

The market sells off, you are thrilled to fill your orders at the bid ready for the bounce. However, the bids keep sinking lower followed by more size on the ask. The support level you have been stalking for days has evaporated as more panic selling ensues. Your stomach drops as the bid collapses lower and you go from happiness to panic as you contemplate taking a stop-loss. You finally stop out as shares continue to grind much lower. Welcome to a potential bear market.
What is a Bear Market?
A bear market is symbolized in the form a bear that is clawing down, compared to a bull market symbolized by a bull striking up with its horns. Additionally, bears like to sneak up on its prey and attack. This is very much how bear markets can happen drastically usually as stocks peak off highs and the dips get deeper and the upward moves get smaller. The pattern of a lower high and lower low continue until the buyers walk away from frustration causing sellers to panic. A bear market is a condition where the major U.S. indexes continue to sell-off (-20%) or more off it’s highs for 60-days or more. That is the technical definition of a bear market. However, the intraday action can feel different for an active trader. Smaller time frames don’t feel any different in a bear market than a bull market, except the follow through tends to be different.
Criteria
Bear markets occur with indexes fall 20% or more off highs for at least 60-days. This causes investor sentiment to turn negative causing stock prices to continue cascading lower and lower.
Economic Implications
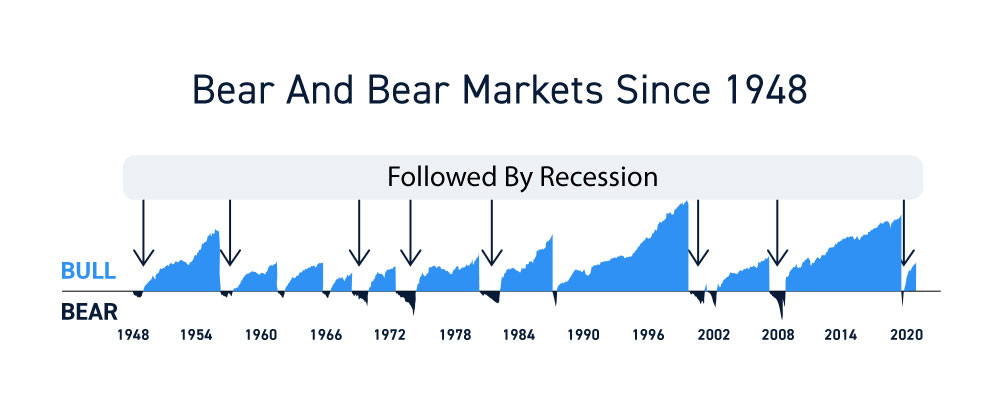
Bear markets tend to precede an economic downturn as recession fears rise and unemployment tends to rise. Just as a bull market tends to occur during economic expansion, bear markets tend to usher in recessions. A recession is considered with two or more sequential quarters of falling gross domestic product (GDP). Since a recession is based on economic reports that are often a month late, bear markets often tend to signal recessions months ahead of time. Since 1948, eight of 11 bear markets have been followed by recessions. On average, the time between a peak and the onset of recession is seven to eight months.
History of Bear Markets
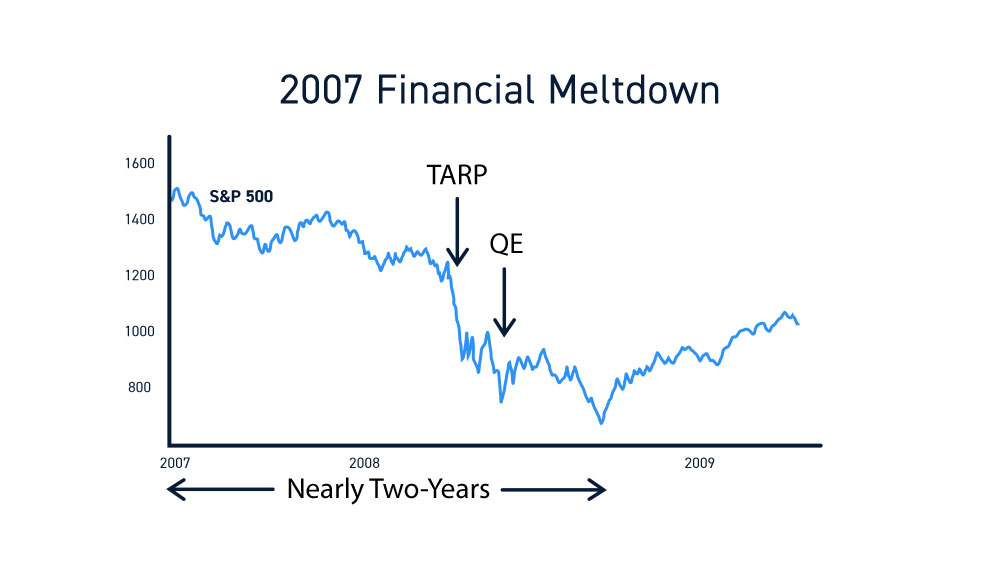
Bear markets tend to occur around every 56 months on average. The average bear market tends to last less than two years. Some bear markets can last just a few months to a few quarters depending on the underlying cause. The 2007 financial meltdown lasted nearly two-years as the U.S. Federal Reserve (Fed) had to implement the Troubled Asset Relief Program (TARP) to finally get the markets to calm down and recover. The Fed then implemented a series of quantitative easing (QE) programs followed by central banks around the world to buy bonds and assets to help credit and equity markets to recover.
Historical examples
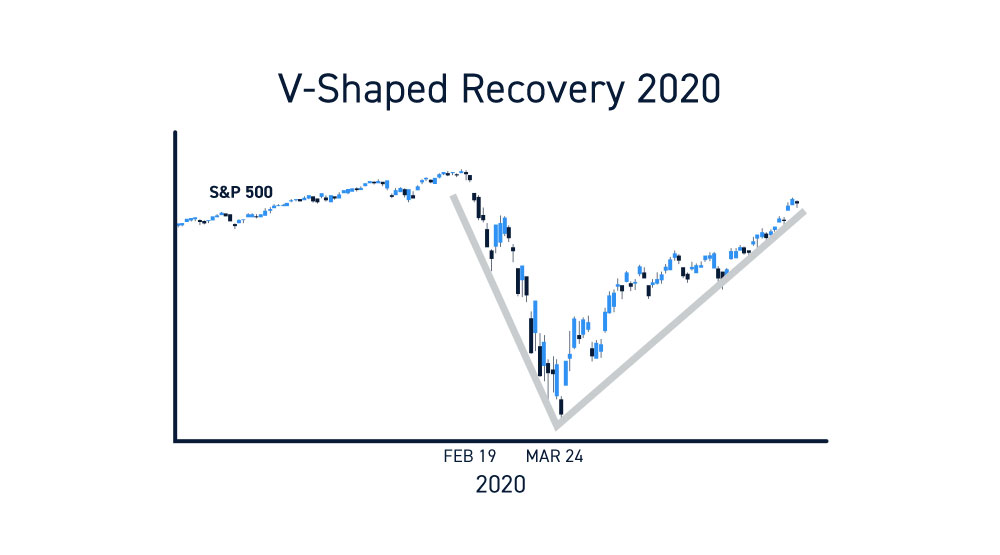
The most recent bear market started on February 19, 2020, during the COVID-19 global pandemic. The S&P 500 fell 27% from the highs and concluded hitting lows around March 24, 2021. The sheer magnitude of pace of the sell-off qualified it as a bear market, but a V-shaped recovery started to occur months after the bottom was put in. The global shutdown was more of a self-inflicted policy based recession that was unprecedented as economics literally shutdown. The recovery is also unprecedented as markets and economics attempt to overlook the nasty sell-off.
How long do bear markets usually last?
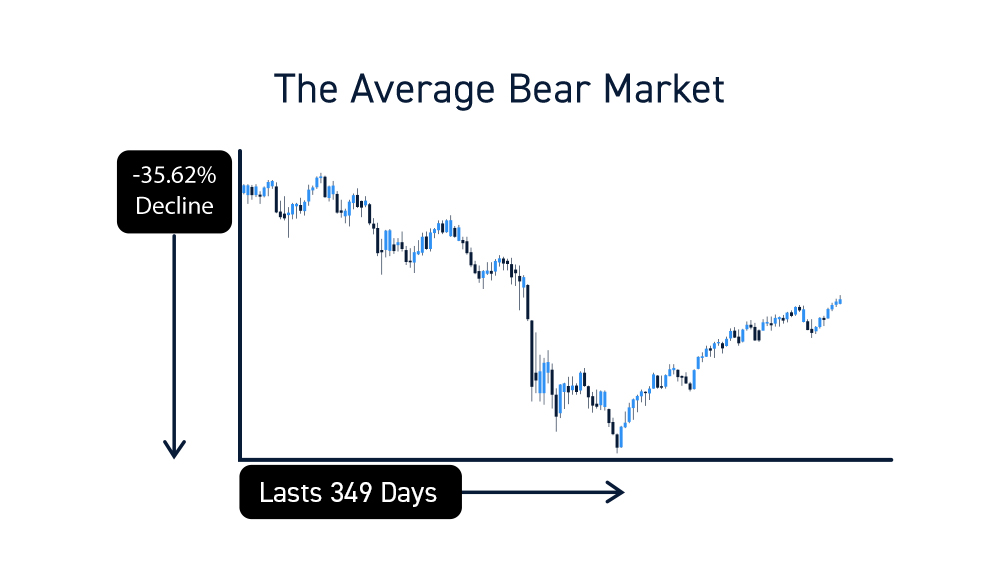
Since 1928, the average length of a bear market is 349 days. Keep in mind, this is the average. The pandemic induced bear market of 2020 literally last only two-months, before markets continued to rally to new all-time highs a year later.
What Causes a Bear Market?
Economic Issues
Bear markets occur during economic contractions, which usually happen as the economic overheats and inflation becomes rampant. Unemployment will start to rise causing consumer sentiment to turn negative. A literal perfect storm of negative economic reports and readings turn the markets overwhelmingly negative.
Market Cycles
The average bear market lasts 349 days versus average bull market lasting 2.7 years. The average bear market results in a (-35.62%) decline for 289 days. The COVID-19 induced bear market of 2020 was the shortest bear market in history.
What Are the Signs of a Bear Market Recovery?
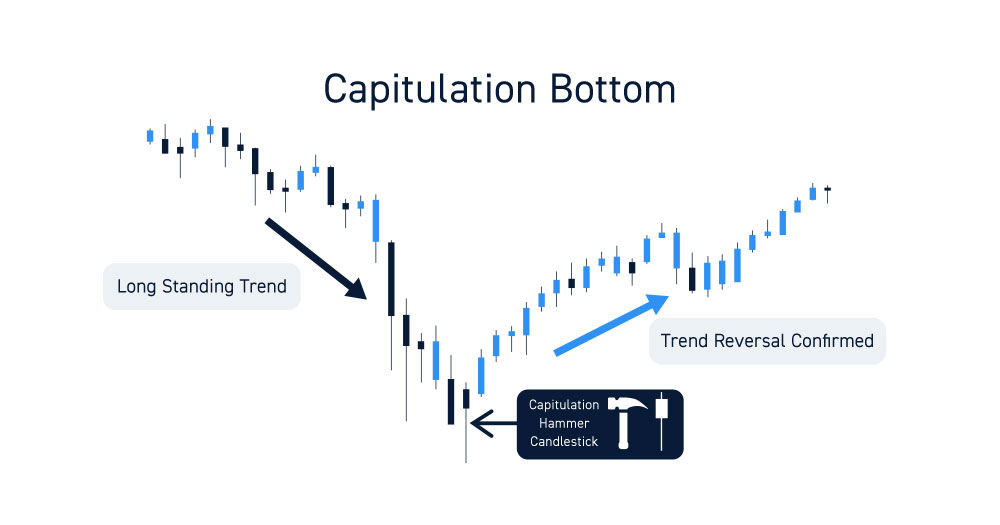
Bear markets recover by putting in a capitulation bottom and slowly make higher lows and higher highs. Use the monthly, weekly, and daily charts to see this play out. The daily chart will recover first by forming market structure low or hammer and higher low candles successively. They can be dramatic or gradual. Make sure to chart the bottoms and have a momentum indicator like a stochastic or MACD to gauge when markets are extremely oversold (IE: under 20-band stochastic) and start to reverse (after a reversion). A reversal is simply a reversion that holds long enough to reverse the trend.
Trading in a Bear Market
Seasoned traders understand they have to adjust their methods to accommodate the nuances of a bear market when trading intraday. A mental adjustment has to be made. A bear market accommodates short-sellers but that doesn’t mean you have to just trade on the short side. Longs can make money in bear markets, but it requires precision to play reversion bounces.
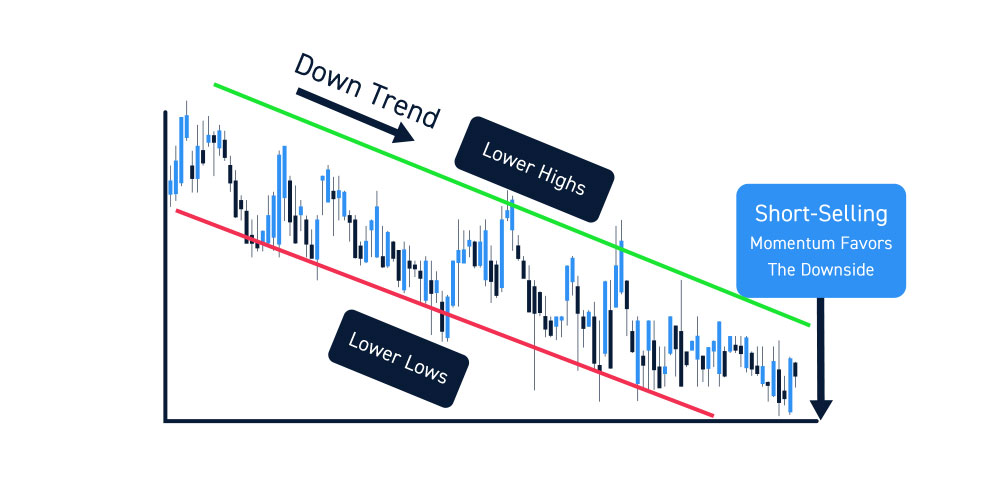
Momentum Favors the Downside
Bear markets happen in the context of downtrends on wider time frames. This means lower highs and lower lows. Down trends can continue for extensive periods of time and bids can literally evaporate. For the most part, short-selling is preferred in general to take advantage of the down trends as momentum often favors the downside.
Sentiment is Overwhelmingly Negative
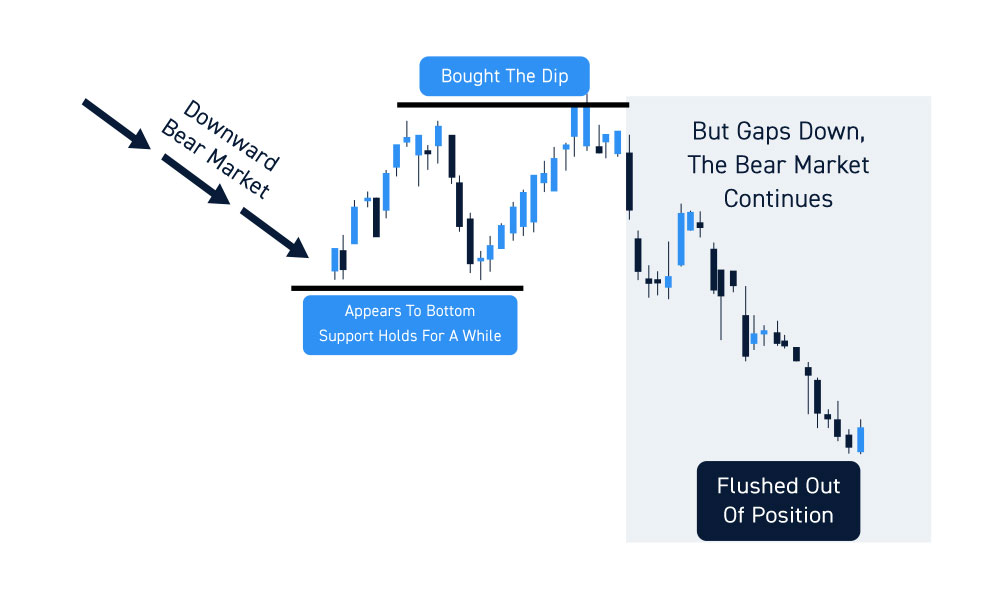
Bear markets have an “end of days” psychology just as stocks appear to make a bottom and recover, they sell off again. Each time buying the dip only to get flushed out as the stock goes lower quickly can have an overwhelmingly negative impact on sentiment. Supports that may have held three to four time can suddenly evaporate on a gap down the next day. Fear of the bottom falling out can trigger panic as each support level gets taken out.
The Majority of Stocks Follow the Market
As benchmark indexes fall lower, stocks tend to follow them lower as well. There will be stocks that manage to grind against the tide but be careful as those outliers can also experience rug pulls as bids evaporate the next day.
Some stocks (i.e. small caps) may not be correlated with broad market trends
On any given day in a bear market, there will always be stocks that rise against the selling. Often times, these stocks will be small-caps that aren’t correlated with the major indexes. Be careful as liquidity may be thin on these stocks, which in turn help them to rise against the tide. The downside is the thin liquidity can equate to a fast freefall if the trend reverses.
Stocks May Struggle to Gain Traction
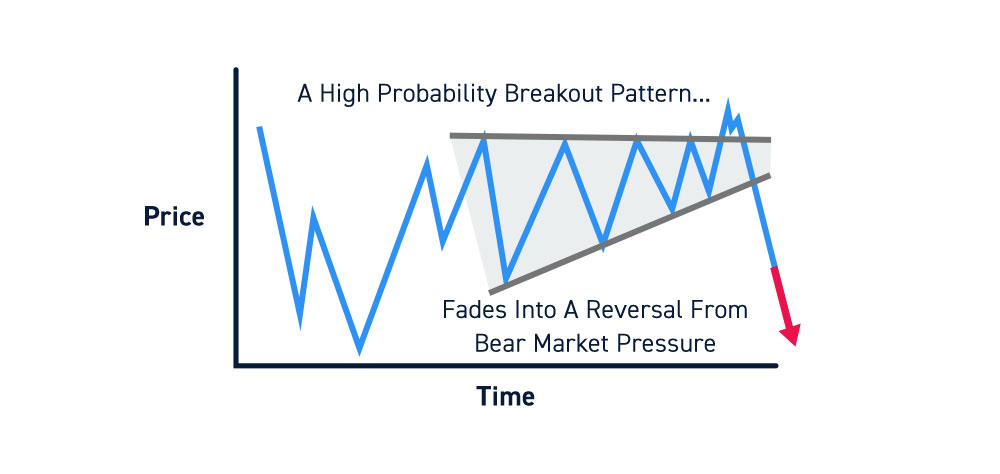
Be prepared to experience failed breakouts. You may have high probability patterns that simply fade the breakouts and reverse back down. Make note of these and be prepared to keep tight stops if playing long or sell into the fade. Bear markets tend to result in limited upside on good news. Bullish news is often a reason to sell into the liquidity while buyers are still there.
Avoid a Long-Bias
In a bear market, try to avoid a long bias as in buy the dip. This is because the dips can turn into extended down trends that you may not be able to average into and recover from. Be very careful with your allocations and avoid buying the dip until you run out of margin. Margin calls are a major factor in bear markets as they trigger forced liquidation. This is why that support you spotted suddenly evaporates as the stock plummets.
This doesn’t mean that long trades cannot be profitable during a bear market; it just means that traders should be cautious, as momentum favors the downside.
You Can Play Both Sides of the Market
Just as in bull markets, you can play both sides of the trade in bear markets as well. While the overall trend may be down, there are times when the panic selling is so strong that shares can get extremely oversold. It’s crucial that you never use all your buying power in any single trade. When you get extreme oversold situations or a powerful uptrend, you can play the reversion and reversals on the long side. Just be sure to scalp those profits as you get them.
Pay Attention to Trends
There are 11 sectors that comprise the S&P 500 index. Make sure you are aware of them and which sectors, industries, or themes (IE: electric vehicles) are strong on a particular day. Use a heatmap and/or exchange-traded-funds (ETFs) as a barometer. This takes assertive effort to monitor, but it will pay off.
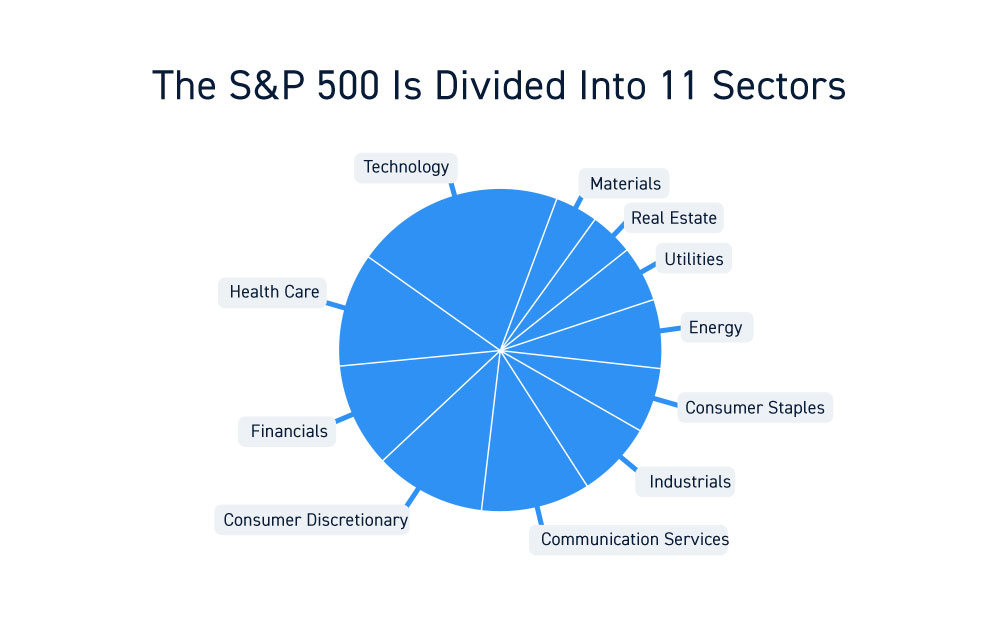
Pay Attention to Performance Across Sectors
Every day, there will be specific sectors indicating strength and weakness. As mentioned, be sure to use a heatmap, ETFs and/or scanner to find the stocks and sectors that exhibit relative strength or weakness against the indexes. Knowing which stocks are the generals in each sector and the peer stocks enables you to create a watchlist and game plan for the trading day. Be aware of the lower tier peer stocks to play when the top-tier leaders are moving.
Focus on multiple sectors and indices
Of the 11 different sectors in the S&P 500, it’s prudent to familiarize yourself with the various peer stocks and be ready to play long-short different sectors through the day. Diversification in active trading is the key so that you are not anchored to just a handful of stocks. You can be the greatest trader in the world but have limited performance when only playing a handful of stocks every day. Keep in mind that stocks need time to for set-ups. Rather than wait for them on a handful of stocks, it helps to be able to alternate between a broader watch list as they form. A scanner helps greatly for this since you likely do not have a research team. Make sure you set trigger alerts on your platform to alert you when prices or patterns trigger.
Improve Your Discipline
It takes discipline to trade bear markets. This means avoiding the fear-of-missing-out (FOMO). You may have stalked and wished for a pullback to a support for days on a specific stock. For some reason, you may have missed the bounce (again) off that support level and you impulsively chase the entry into the stock. In a bull market, you may still get rewards with upside. However, in a bear market, chances are your gains on the long side are short-lived as the bids evaporate and collapse back to the support as it also collapses. In the end, you stop out (again). Avoid impulse trades and make sure you are putting in alerts on your platform to avoid chasing.
Follow Your Trading Rules
This goes without saying. Avoid chasing stocks up or down. Be patient and scale at very strong support or resistance levels. Don’t hesitate to take a stop-loss especially if your size allocation is ‘heavy’. Never use full margin buying power on any single trade. Always leaving extra buying power so that you don’t face a forced liquidation margin call.
Don’t Bring “Bull Market Habits” Into a Bear Market
Buy the dip doesn’t work in a bear market. You will notice firsthand the difference in a bear market when you scale into a position delighted that it’s tanking so fast and you are getting “cheap” shares. The giddiness that you felt loading up at a very good average price can turn into absolutely horror when shares continue to sell-off lower than you imagined. As the day wears on, you find yourself in an “all-in” position much higher than where the shares are trading (much lower). At the end of the day, you must decide. lose a few fingers or an arm? This means your 4-to-1 intraday margin will shrink to the 2-to-1 overnight margin. The shares may be trading at the lows of the day. You will have to sell half the position or risk margin calls in the morning, because the stock did not bounce. In the morning, you’ll likely face forced liquidation especially it if gaps down. The key is not getting into this situation in the first place. Heed the title of this paragraph!
Don’t fight the trend
Be aware of the time frames and the trends. While wider time frames may seem insignificant when trading intraday, they are like the riptides that is the eventual direction. Don’t get into a habit of fighting the wider time frame trends. If the shorter time frame is bullish, but the wider time frame is bearish, make sure to keep your long trades to short-term scalps.
Be on the Look Out for a Change in Sentiment
A sentiment reversal can form as trends start to reverse up. The reversals will always start with the shorter timeframes but be aware when the wider time frames start to make the higher highs and higher lows. Markets will always move ahead of the economic readings, so be sensitive and aware of the potential for a reversal.


