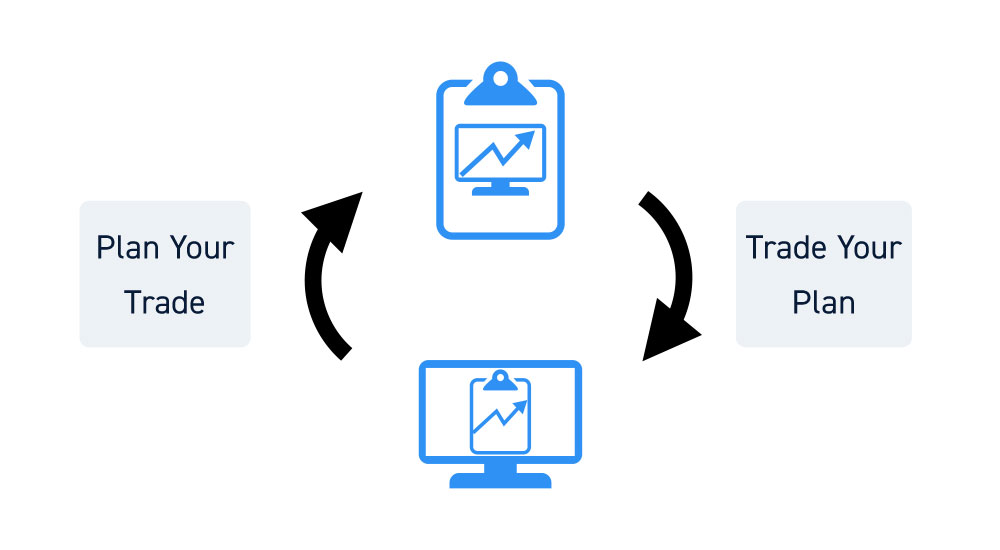
The familiar trading cliché, “Plan your trade and trade your plan” sounds like common sense, but only if you know what a trading plan is and how to make one. Trading takes preparation which includes planning ahead of time.
The Importance of Planning in Day Trading
Day trading is often mistaken for impulsive trading, which is dangerous. Seasoned day traders that have lasted in this business know that planning is the toughest but most crucial part of the game. It takes legwork and effort to plan out your trades ahead of time. It’s too easy to impulse trade in and out constantly. You end up churning yourself and often blowing up your account.
The markets can’t be controlled, but your actions can.
The markets are chaotic. Take control by planning.
What Makes a Good Trading Plan?
There are three main factors that separate a good trading plan from a bad or flawed trading plan. Every trader will approach this a bit differently, but few successful traders skip this part of the process.
Objectivity
While it’s easier said than done, especially when money is on the line, your trading plan must be objective. This is easy to keep in mind prior to entering the trade, but it can get tough really quick if the trade moves against you. Remember, facts first, no biases, and no emotions. To do this, you have to stick to your trading plan which should include both stop-losses and targets (which we will discuss shortly).
Comprehensiveness
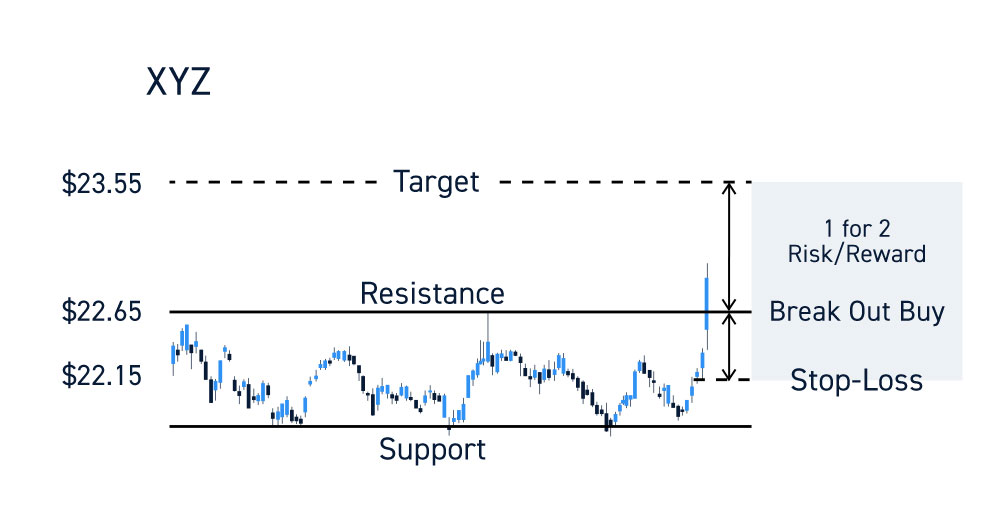
Every scenario should be accounted for in the trading plan so that you aren’t caught scrambling when panic sets in. Plan for every kind of possible movement – both success and failure. All things must be considered. This includes the entry price, stop loss and profit targets. For example, if XYZ stock breaks out at $22.65, then buy 500 shares with a $23.55 target and $22.15 stop-loss. This is a 1 for 2 risk/reward scenario.
Adaptability
Markets are dynamic. Situations and context can change at any moment. However, the beauty of trading is the simplicity of reacting to the numbers rather than trying to justify a reason to stay in a losing position. You should always adapt to the market.
Look for gaps in your plan and strive for constant improvement. Sometimes, a stock may move based on the overall context of the market climate rather than individual conditions. As a trader, it’s important to factor in the market trading climate (risk on/risk off) ahead of time. This also enables you to spot “fades” when they occur. Fades are when a stock moves against the benchmark indexes or futures (IE: XYZ rising why S&P 500 futures are falling hard).
How to Make a Trading Plan
Here are five steps you can follow when creating a trading plan.
Step 1: Define Your Trade Criteria
What type of stocks are you looking to trade?
Perhaps you are most comfortable with trading social media stocks, or materials stocks or semiconductor stocks. Identify what stocks you have had success with and stick to that sector and industry. If you don’t know what type of stocks you favor, then don’t trade yet.
Of course, it’s fine to expand your universe of familiar stocks, just make sure you have a trading plan for it. This should guide all of your trading activity. As you improve, you can add more to your trade criteria by including specific patterns and set-ups to narrow the filtering.
Here are some factors to consider when defining your ideal trade criteria:
- Sector
- Stock Price
- Market Cap
- Long/Short
- Risk/Reward
- Chart Patterns
- Volatility
- Timeframe
- Etc
You won’t know what an ideal trade looks like if you don’t define it in advance.
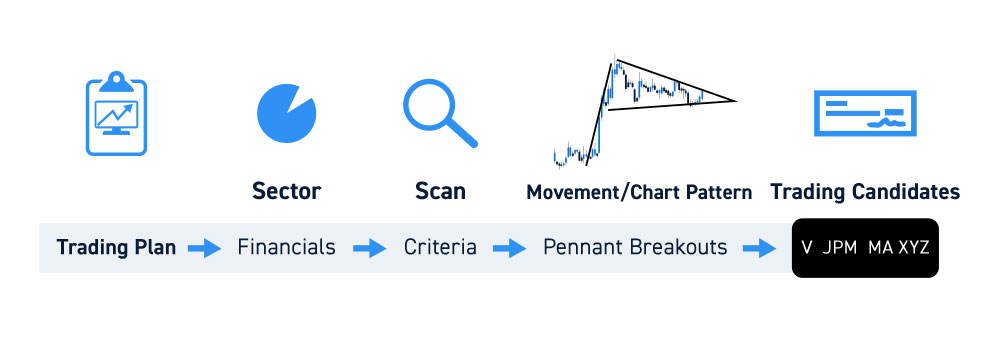
Step 2: Identify Trade Candidates
Once you have defined your ideal trade setup, it’s time to find potential trade candidates. The nice thing is that where there’s one good trading stock, there will likely be a few more in the form of peer stocks within the same industry.
You can also use various scanners to find stocks that are moving well and or making specific pattern set-ups (IE: flag, triangles, and pennant breakouts). Find the stocks that meet your criteria for the day.
Step 3: Identify an Opportunity
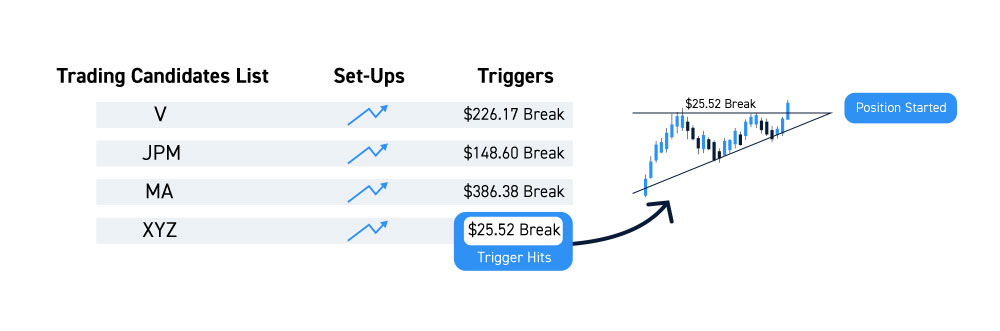
Narrow your list of candidates down to the best one and objectively analyze the opportunity. We covered this a bit in Step 2. The opportunities lie in the specific pattern set-up. Once you’ve got your list of trading candidates, watch for the set-ups, and identify the exact triggers (IE: XYZ ascending triangle breakout triggers on the $25.52 break).
Step 4: Create the Well-Rounded Trade Plan
Here’s the meat and potatoes. It is time to create a trading plan with the information you have compiled. Imagine you are training a robot with a set of instructions also known as algorithms. Compose your trading plans with step-by-step robotic instructions at certain triggers based on price action. Your trade plan should allow you to execute the trade robotically. Everything is planned before the trade is initiated. Here are the crucial components to consider.
Perform a Risk/Reward Analysis of the Trade
In a nutshell, how much are you willing to risk to make a reward. Ideally a 1 for 2 is a great ratio (IE: risk $0.50 to make $1.00). Be sure that the probability for hitting the reward before taking on the risk is high. This probality improves with the type of pattern set-up.
Rationale
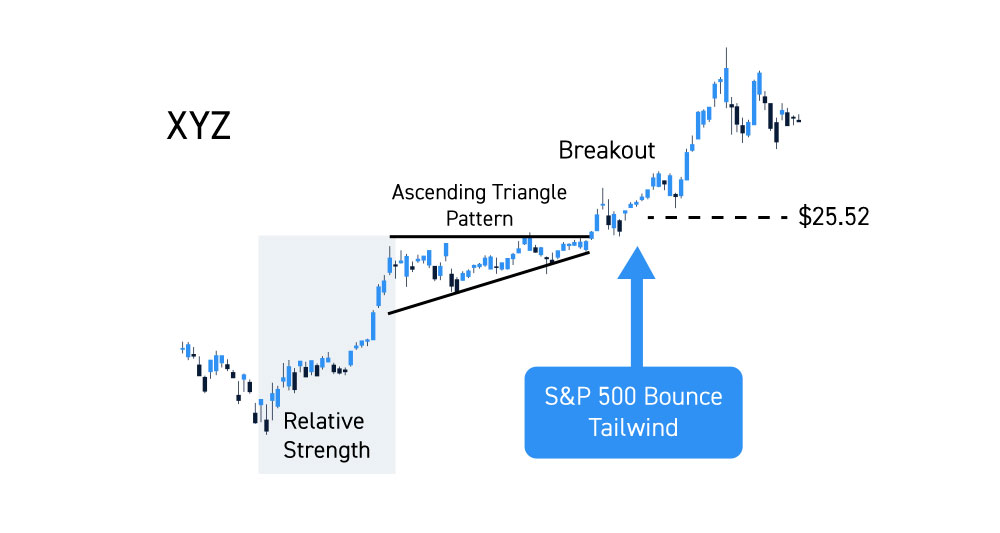
Ask yourself what is the rational or premises for the trade. Why did steps 1-3 lead you to this trade? For example, XYZ stock is showing relative strength as it sets up an ascending triangle breaking on the 15-minute chart. The S&P 500 has been weak but nearing a strong support level for a bounce. The bounce on the S&P 500 should provide wind on the back of XYZ stock for the ascending triangle breakout on a $25.52 price break.
Entry Price Target
What price do you expect to enter? If the breakout triggers at $25.52, then you can set your entry at $25.55 to get a fill executed.
Position Size
How many shares are you planning to trade? You can scale in or just enter with one entry. The position size is based on your risk/reward ratio. If you are risking $500 to make $1,000, then you will look to enter 1,000 shares at $25.55.
Stop-Loss
What is your stop-loss price level if the trade breaks down? Again, revert to your risk/reward of 1-for-2, which means a $0.50 loss for a $1.00 gain. If you’re entry is $25.55, then $25.05 is your stop-loss price level.
Profit Target
What is your profit target where you will take money off the table? If your reward is $1.00, on XYZ stock, then $26.55 is your price target. You can have multiple price targets as well if the set-up is particularly strong and the wider time frame trend is strong. Also consider a trailing stop as the trend gets underway so that you don’t give back your profits. If XYZ accomplished the $26.55 target, you may opt to sell half your position and ride the other half to $27 with a $0.30 profit-stop.
Timeframe
This applies both in terms of which timeframe chart are you focusing on and the timeframe for the trade to play out.
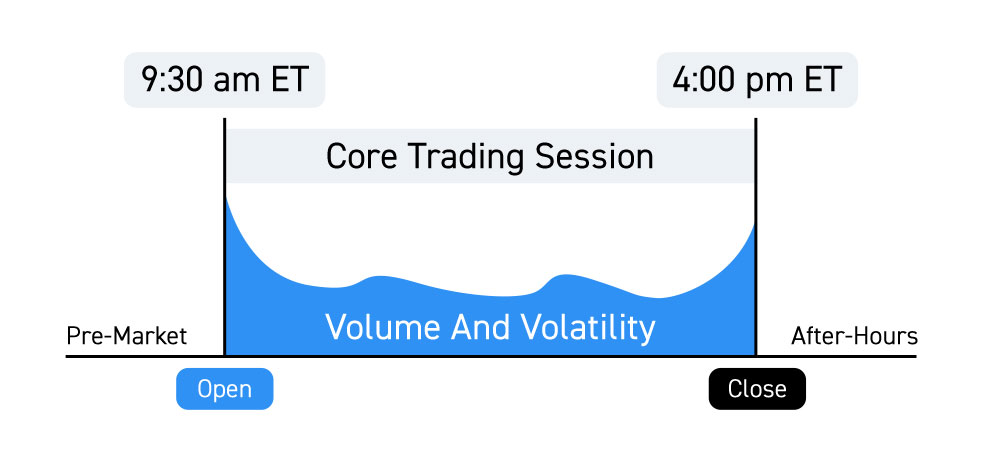
As an intraday trader, you are naturally limited to market hours as opposed to a swing trader that may hold a position for several days. The open and close traditionally have the most volume and volatility. If you don’t plan on taking overnight, then be aware that the market closes at 4 PM EST, unless trading afterhours.
Prioritize the timeframe chart and gauge the nominal holding time for the trade to play out (IE: 15-minute chart and up to 3 hours to play out, which is 12 candlesticks).
Contingencies
As much as we want trades to play out simplistically, they rarely do. XYZ stock may only get to $26.45 before peaking and plunging back under $25.50. Therefore, it’s crucial that you have contingencies in case things don’t happen the way you expect them to.
For example, you may plan on adding shares of XYZ on pullbacks to $25.40 to average in up to 1,000 shares. Your profit stop may be indicator based where the 15-min 5-period moving average breaks or the stochastic oscillator crosses back down. There are number of contingencies you can add to your trading plan to engage in the nuances of the trade. Don’t impulse trade or chase the trade if you missed the entry. Move onto the next candidate.
Step 5: Analyze, Optimize, Repeat
After you complete the trade, you should analyze the trade and find ways to improve next time. What went well? What went poorly? What will you do different next time?
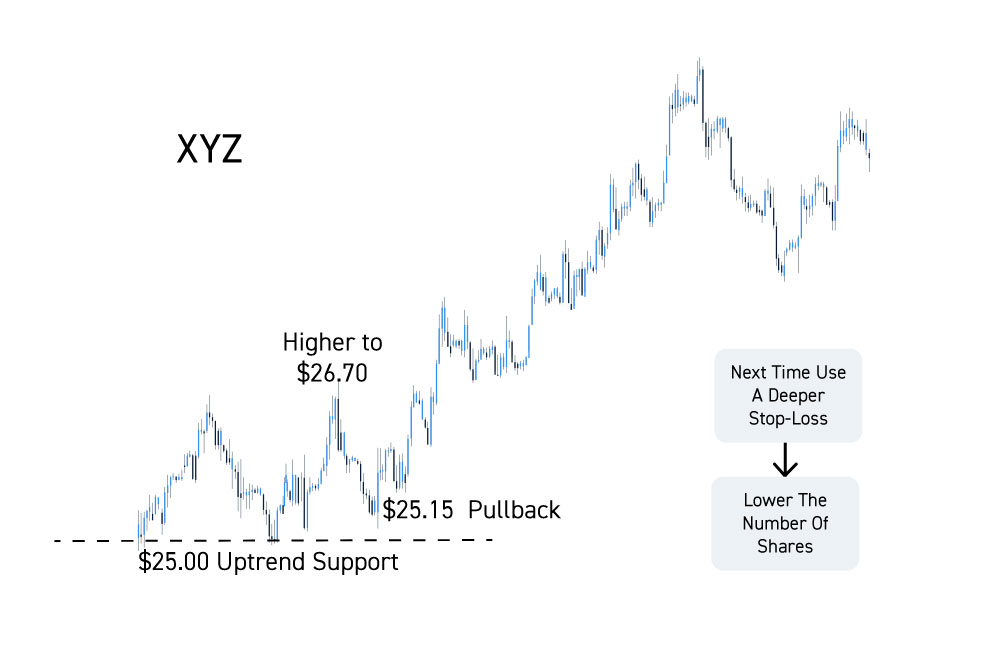
Perhaps the set-up and trigger were great, but the share size was too much and you were stopped out quickly on XYZ at $25.15 on a pullback before it continued to move higher to $26.70. You notice that $25.00 was the uptrend support on the 60-minute chart and conclude that next time, you will use a deeper stop-loss when the 60-minute chart is uptrending. In order to feel comfortable with that kind of stop, you might lower the number of shares in the trade entry next time. Remember that each trade, especially stop-losses, are a learning experience that help you optimize your trading with real data.