Technical analysis utilizes charts and indicators to analyze the price action of an underlying stock. One of the most useful and widely used technical indicators are moving averages, which utilize price history, to anticipate future price action.
What Are Moving Averages?
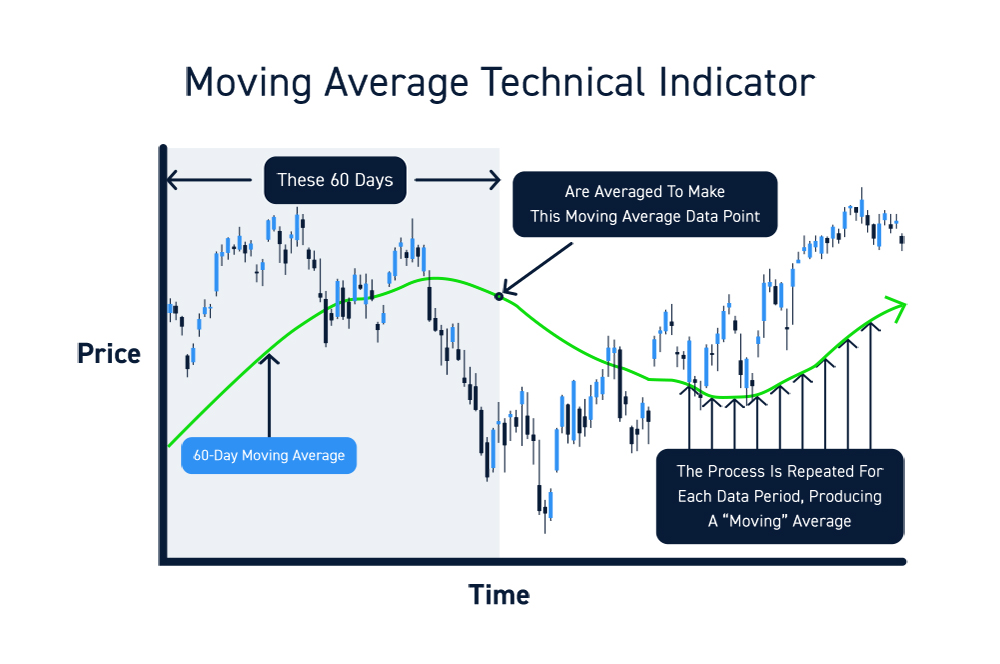
Moving averages are chart-based technical indicators used to determine various qualities of an underlying stock’s price action. They are drawn as lines plotted on a stock chart that represent the average price for a specified period of time. For example, a 60-day simple moving average would represent the average closing price of a stock for the past 60-days.
These indicators are considered “moving” averages since prices are continuous throughout the session or series of sessions.
Why Use Moving Averages?
Until you actually see them in action, it may be hard to believe but moving averages provide a visual illustration of key price levels. Moving averages take a series of numbers and bring them to life by providing a historical price roadmap comprised of three basic components: trend, support, and resistance. Let’s take a closer look at each of these components.
Trends
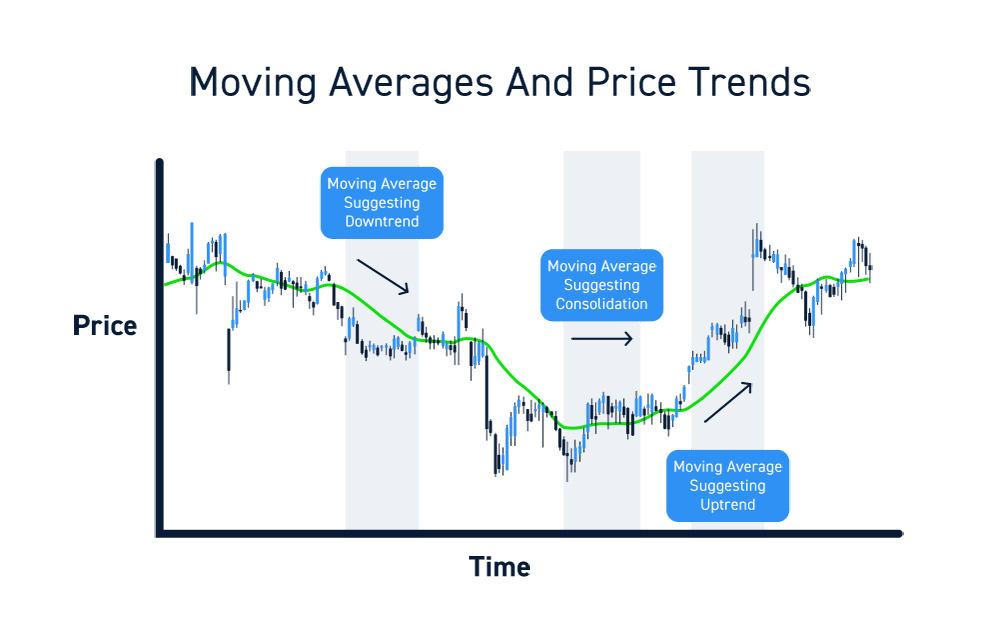
When analyzing a stock, the first question should be whether there is a price trend in place. There are two types of trends: uptrends and a downtrends.
Uptrends indicate buying pressure resulting in rising prices that sequentially make higher highs (price spikes) and higher lows (price pullbacks).
Downtrends indicate selling pressure resulting in falling prices that make sequentially make lower lows (price drops) and lower highs (price bounces).
When a stock is not in a trend, it is considered to be choppy in a consolidation. Consolidation precedes trends. While many seasoned traders can visualize price trends just by looking at their stock charts, it helps to have a definitive indicator that quantifies the trend as well as its components, support and resistance.
Support and Resistance
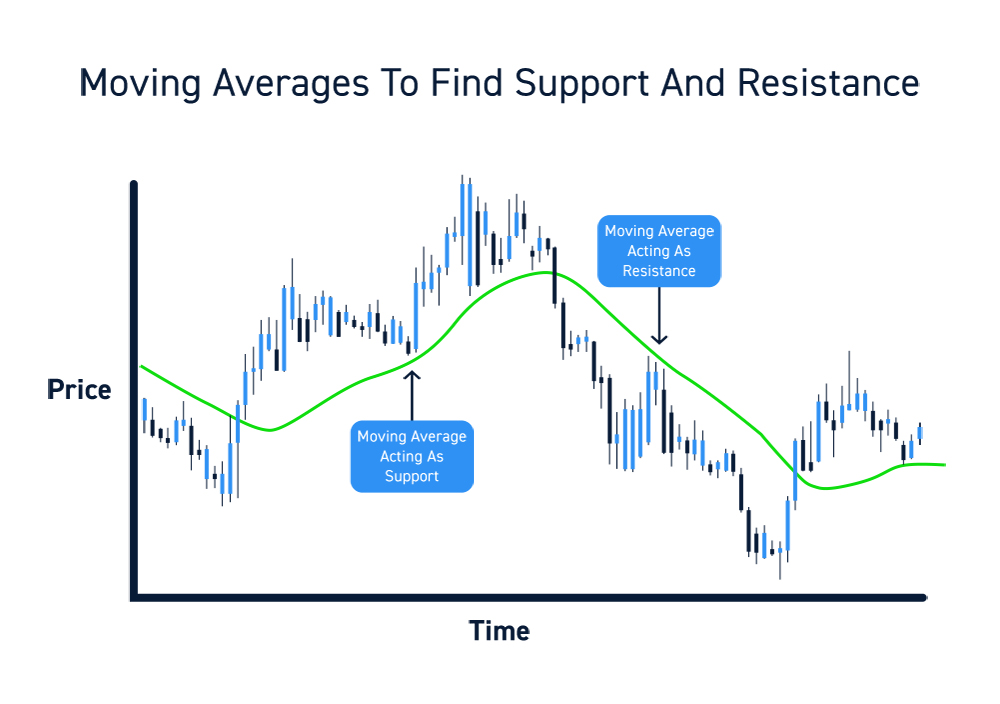
As a stock moves up, you will notice how the pullbacks tend to stop at certain price range before resuming another thrust up. As this process repeats, the net outcome is a stock that is making higher highs and higher lows.
The higher lows are shallower pullbacks at which the price “stops” before continuing its uptrend. Wouldn’t it be great to be able to predict where these “stops” may be? That’s what moving averages often do.
Moving averages quantify the support level where an uptrend pullbacks to before the price bounces to new highs again. Keep in mind that downtrends are the inverse of uptrends. This means the downtrend support is the resistance level on bounces as the stock makes lower lows and lower highs as the net results is falling prices.
It should be noted that no technical indicator offers certainty. While stocks tend to find support and resistance at key moving averages, they may also move below or above these lines (which may indicate a potential reversal of trend).
The Types of Moving Averages
There are two main types of moving averages: The simple moving average (SMA) and the exponential moving average (EMA). From those two types of moving averages, many different tweaks have been applied to derive other types of moving averages. Each of these moving averages are useful for traders and accommodate the preferences of individual traders.
It’s best to start with the simple moving average to get a feel for moving averages. Sometimes, the simple option is the best option. Popular moving averages may also be more likely to serve as support and resistance as traders and investors accumulate or distribute shares at these levels.
Simple Moving Averages
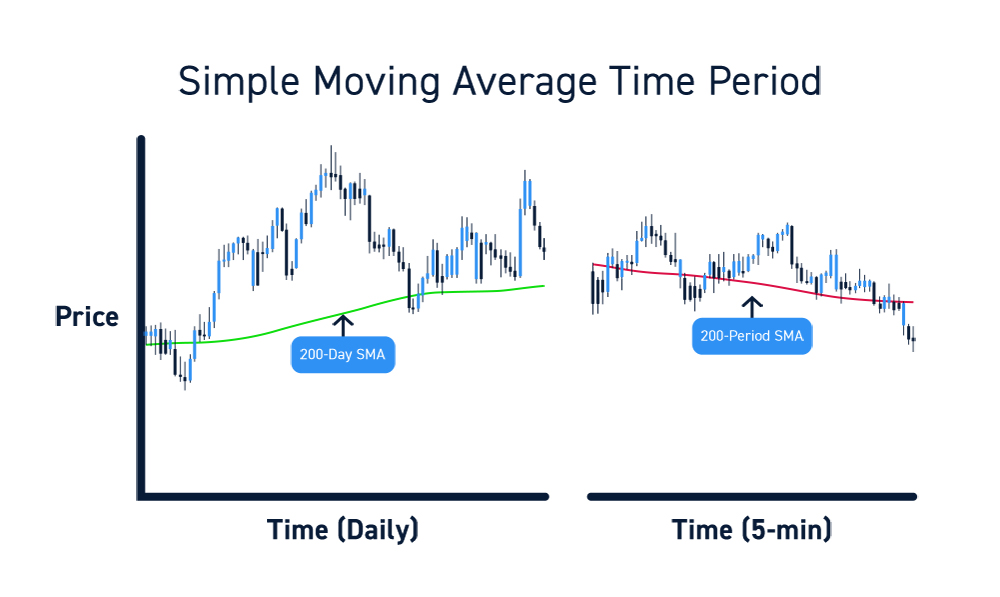
The most widely used moving average is called a simple moving average. This indicator “simply” takes the total number of trades in a series and derives the average price for that period.
The period is represented by time increment. For example, a 200-day simple moving average represents the average of the past 200 closing prices. A 200-period simple moving average plotted on a 5-minute chart would represent the average closing price of the past 200 5-minute candles.
Simple moving average (as well as any moving average) can be plotted across any timeframe.
Exponential Moving Averages
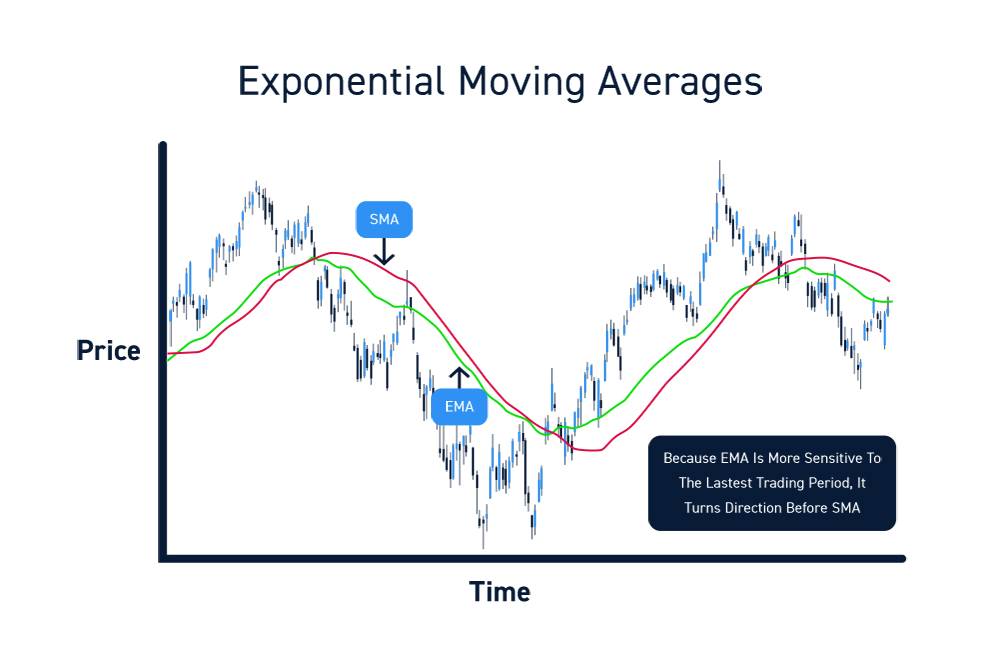
The exponential moving average is a “weighted” moving average that assigns more weight to the most recent trades or prices near the end of the time period carry more value. The theory is that the most current trades carry more relevance as an indication of buying or selling pressure, and therefore deserves a higher weighting.
How to Use Moving Averages
As discussed earlier, moving averages can be used to identify trends and key prices levels (support and resistance). Here are a few ways you can apply these to your trading.
Moving Average Crossovers
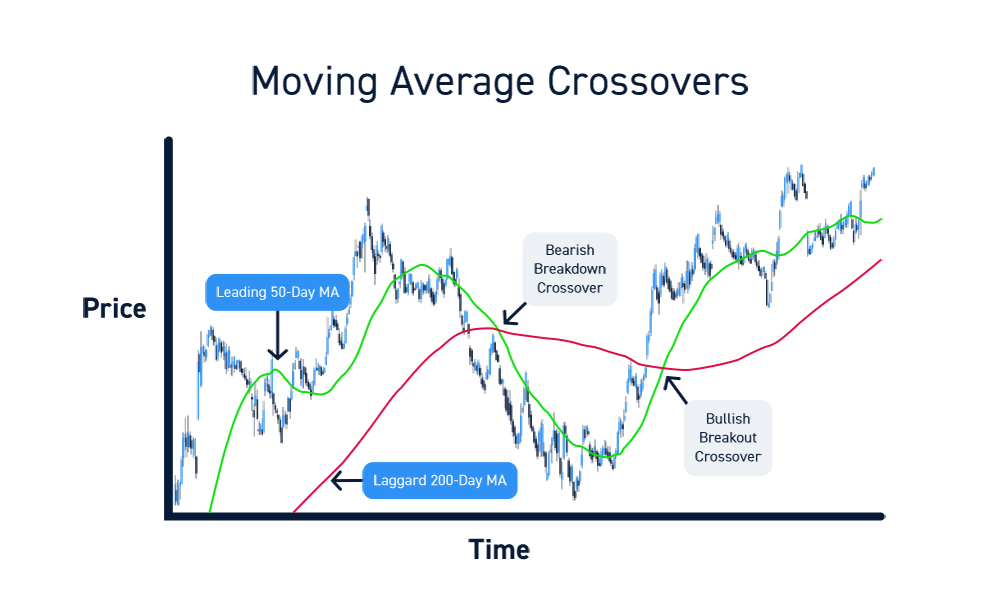
A moving average crossover occurs when the leading moving average (shorter timeframe) crosses through the laggard moving average (longer timeframe). If the crossover is up, that’s a breakout. If the crossover is down, that’s a breakdown.
For example, if a stock’s 50-day moving average crosses above its 200-day moving average, this crossover represents bullish short-term price momentum and may serve as a good entry point for a long trade. The crossover indicates that the stock has been accelerating at a more rapid pace over the past 50 days compared to the past 200 days. If the 50-day moving average crossed below the 200-day moving average, this would be a bearish crossover that may serve as a good entry point for a short trade.
Identify Entries and Exits
Moving averages can also be used to refine your entries and exits.
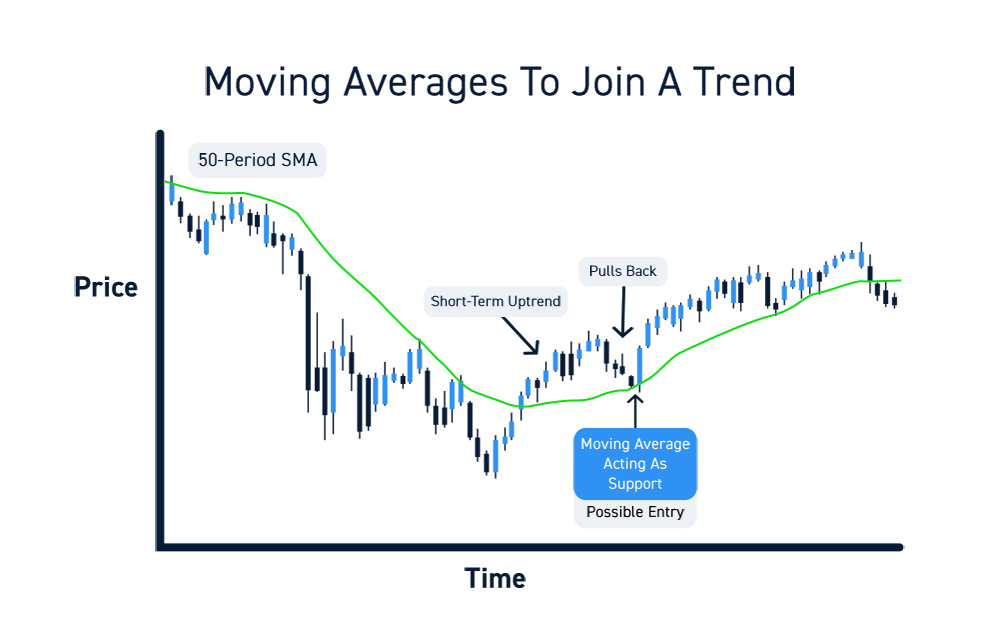
If you want to join a trend, you may consider buying a stock on a pullback to a key moving average (assuming it holds as support). For example, if a stock has been in short-term uptrend above its 50-period simple moving average, you may consider an entry when the stock pulls back and tests this average as support.
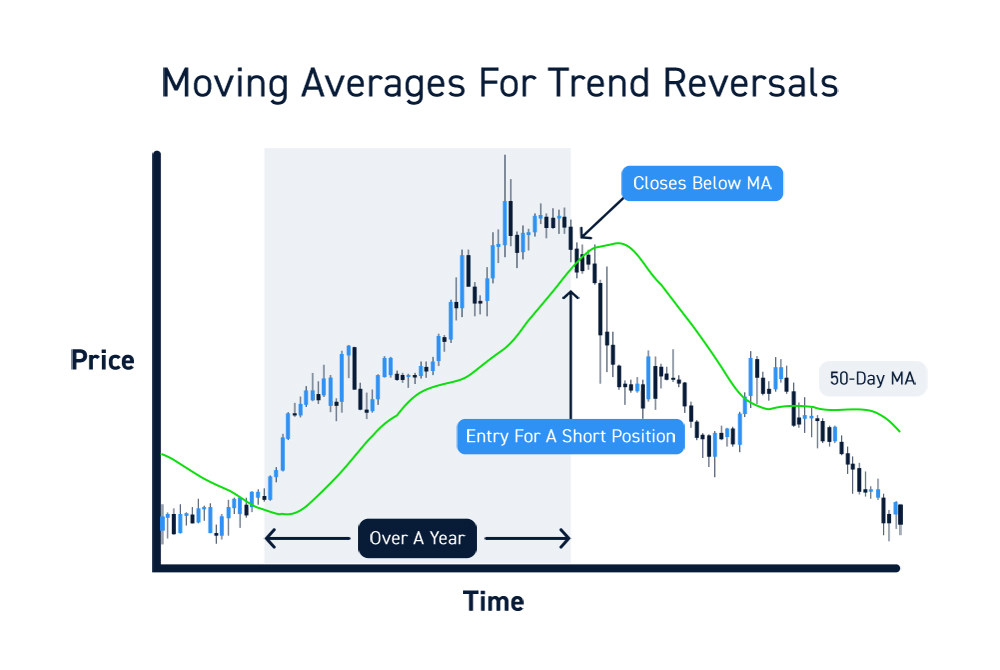
If you are looking for trend reversals, you may consider an entry as a stock breaks above or below a key moving average. For example, if a stock has been trading above its 50-day moving average for over a year, you may consider an entry for a short position when the stock closes below the 50-day moving average. Similarly, if you were already in a long position, you may consider exiting your position at this same point.
How to Choose Your Moving Averages
Every trader has their own preferences when it comes to moving averages. Here are a few tips for choosing which moving averages to include on your charts.
Keep it Simple
Moving averages are intended to smooth price action. If you overload your chart with too many moving averages, the indicators become counterintuitive. Experiment with a few different moving averages and determine which ones actually help you make better trading decisions.
Focus on Your Trading Style
Traders should use the moving averages that are most relevant to their strategies. For example, swing traders may use moving averages on hourly charts whereas day traders may rely on short-term intraday averages (like VWAP or a 7-period EMA).
Don’t Reinvent the Wheel
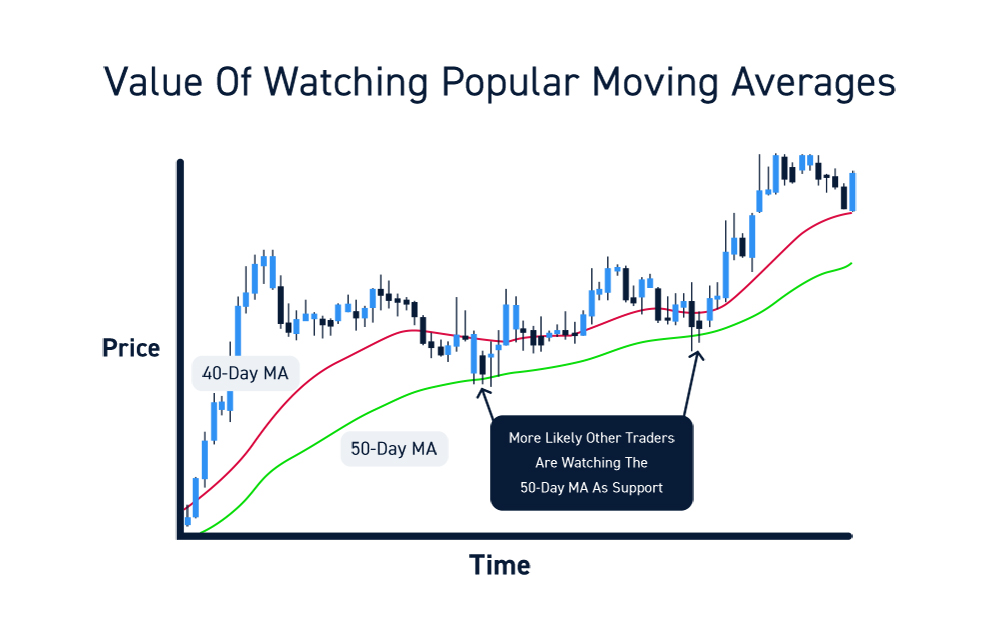
The effectiveness of moving average can be partially attributed to their “self-fulfilling” component. For example, intraday traders tend to look at VWAP (a volume weighted moving average) so buying behavior may be affected around this average. Similarly, many traders look at the 50-day and 200-day moving averages to identify longer-term support and resistance levels. The effectiveness of these moving averages as key price levels may be partially attributed to the fact that so many traders are watching them.
There’s a lot of value to watching the moving averages that other traders are already watching. While, theoretically, a 40-day moving average may be as relevant as a 50-day moving average with regards to price smoothing, the 50-day is more popular and more likely to help you pinpoint key price levels.