

Successful trading relies on finding the best price points to buy and sell securities. This requires being able to effectively identify price support and resistance levels, which in turn will help to determine entry and exit prices. This enables traders to gauge their risk and reward variables as well as share sizing.
What Are Support and Resistance Levels?
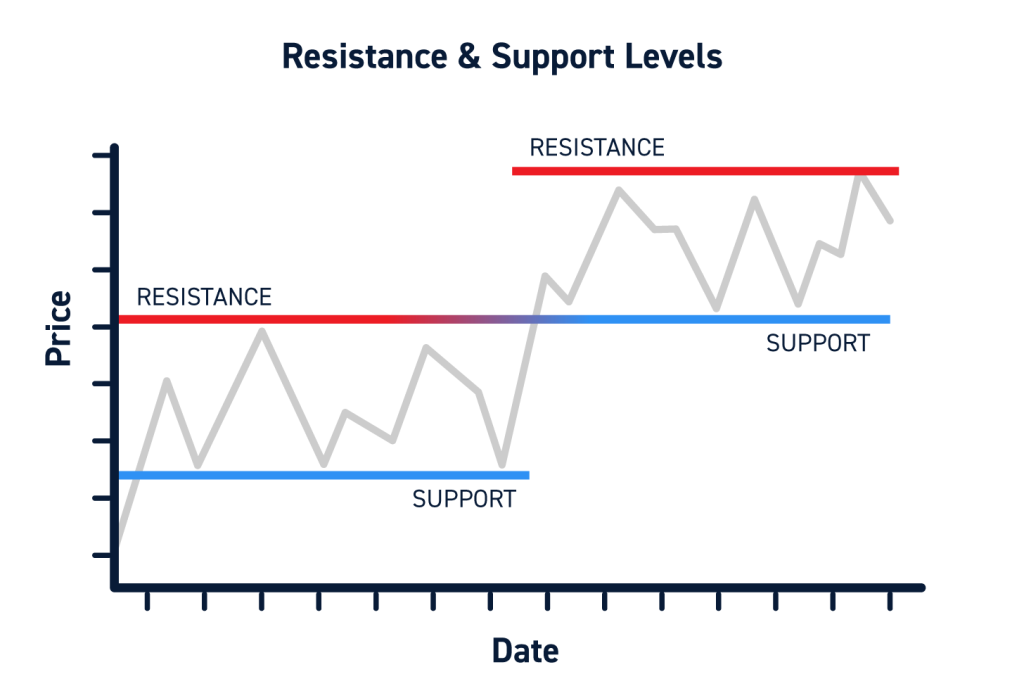
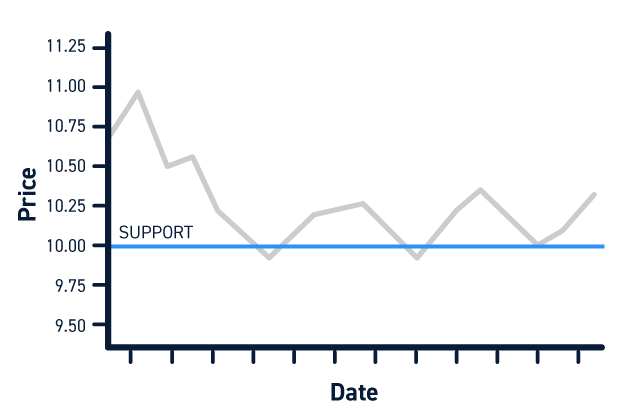
Support and resistance levels are price levels where a stock tends to reject the current trend and reverse.
Support levels are areas where buyers overpower sellers and push a stock’s price upward after a downtrend.
Resistance levels are areas where sellers overpower buyers and push a stock’s price downward after an uptrend.
It can be helpful to think of these terms in the context of a real world marketplace. Assume a hotel has rooms priced at $200 per night, but due to a lack of demand, the hotel has to decrease the nightly rate. At what price are customers likely to start taking an interest? $180? $150? $100? The area at which buyers start showing an interest would be considered the support level. On the flipside, if the hotel decided to raise rates, the level at which buyers would no longer tolerate the prices would be considered the resistance level.
The same phenomenon occurs with every stock. Support and resistance levels are present across all timeframes. There are support levels on intraday charts, daily charts, weekly charts, and so on. Stocks can have multiple support and resistance levels – reflecting different areas where new groups of buyers and sellers take interest in the stock.
Why You Need to Understand Support and Resistance Levels
Support and resistance levels help traders plan better trades.
You need to understand support and resistance levels because they can provide entries and exits as well as price targets and stop-loss triggers. You may plan entries for long trades at support levels and exits at resistance levels.
For example, if XYZ has a support at $25.25, then you may go long at $25.25 and target the $25.75 resistance level to exit the position for a $0.50 profit. Your stop-loss might be placed at $25.00 when you factor in a 1 for 2 risk to ratio equating to a (-$0.25) stop-loss.
Types of Support and Resistance Levels
Support and resistance levels can be both static and dynamic.
Static support and resistance levels are price levels that remain the same, regardless of future trading activity. For example, if a stock has bounced off of the $100/share price point three times in the past year, this may be considered a static support level.
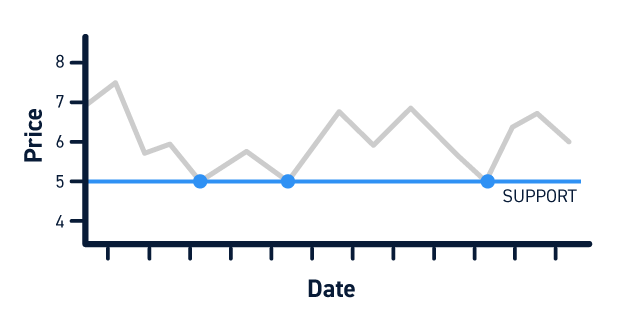
Static support and resistance levels are best identified by simply analyzing a chart and seeing which price levels tend to hold. They can also be identified using technical analysis tools such as Fibonacci retracements and pivot points.
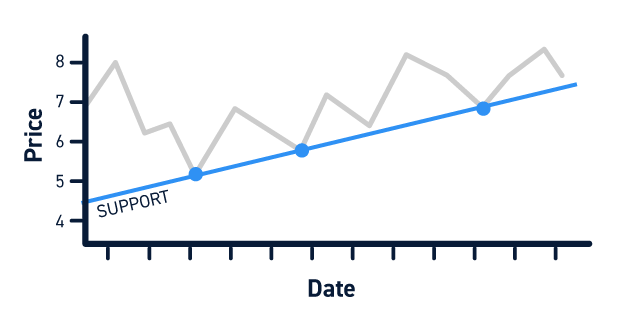
Dynamic support and resistance levels are calculated using a continual supply of updated data throughout the day. For example, a stock may find support at the 50-day moving average (the average of the past 50 closing prices). As more trading data presents itself, the price of the 50-day moving average will change and so will the corresponding support (or resistance) level.
How to Find Support and Resistance Levels
To find static price levels, you can use technical indicators like trendlines, pivot points and Fibonacci retracement levels. Most charting platforms enable you to plot or draw static support and resistance lines, which are based on historical price levels. There are also psychological price levels like round numbers, $2.50 and $5.00 whole number levels which correspond with options strike prices.
Fundamental factors can also create support and resistance levels. Some of these factors would be initial public and secondary stock offerings. A syndicate support level can be formed based on the offering price (IE: secondary stock offering price of $55). Another fundamental price level can be based on a financial metric like cash per share (IE: XYZ cash per share is $10). This is logical in that if the stock trades down to the cash levels, then the intrinsic value is achieved while the rest of the business is free.
To find Dynamic price levels, you can use technical indicators like moving averages, and channel indicators like Bollinger Bands, PSAR, Keltner Channels across multiple time frames. You can use drawing tools on most platforms to create trendlines and update them manually as levels break and new channels are created. Moving averages can be tweaked from the simple moving average to weighted and exponential moving averages.
There are also widely followed moving averages like the volume weight average price (VWAP) which can act as a dynamic trendline. Keep in mind that different timeframes will produce different moving averages, which in turn can result in diverging trends amongst time frames (IE: 60-minute chart has an uptrend, but the 5-minute chart has a downtrend).
Additional Considerations
There are additional factors to consider when trading with support and resistance levels.
Support and Resistance Levels Don’t Always Hold.
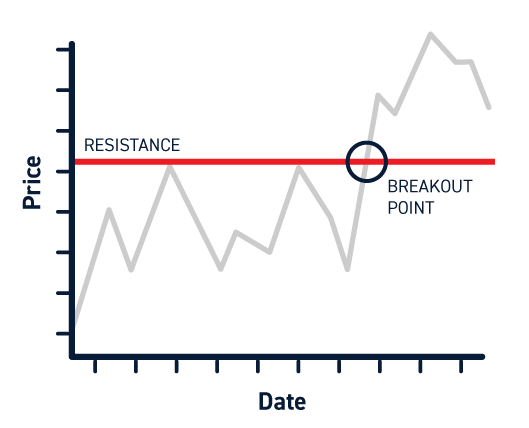
Support and resistance levels represent historical inflection points on a stock. While history shows that these levels have held in the past, there is no guarantee that they will hold in the future.
It is fairly common for a stock to break below its support level (breakdown) or above its resistance level (breakout).
Traders should be aware of these levels and plan accordingly. For example, if a stock had support at $10 and that support level held, a trader may enter a long position. If that support level broke, a trader may enter a short position.
Find the Relevant Support and Resistance Levels for a Specific Stock
Every stock has its own unique trading pattern. A 200-period 60-minute support may be a significant support on one stock, but irrelevant on another.
Analyzing support and resistance should be done at the stock-level. Pay attention to which support/resistance levels are relevant for the specific stock and timeframe you are trading.
Support and Resistance Levels are Not Always Exact
Support and resistance levels are guides, not price points etched in stone.
Consider giving yourself wiggle room when incorporating support/resistance analysis into your trade plan.
For example, a $5 support level may experience a sell-off to $4.90 before bouncing back up the support. Therefore, it’s important to be aware of how much wiggle room to give for any specific stock you trade.
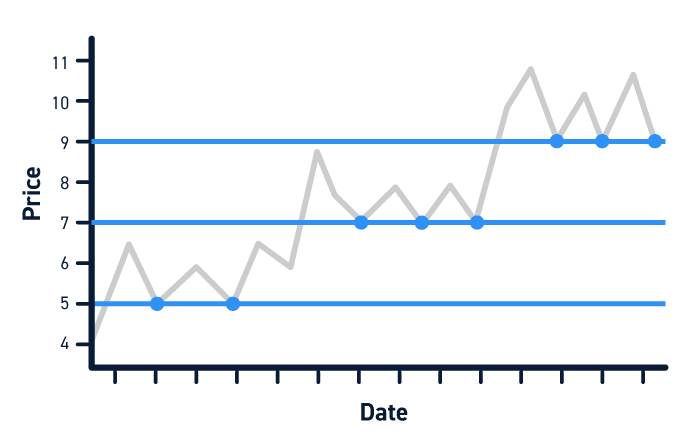
Plot Multiple Support and Resistance Levels
It’s prudent to plot multiple support and resistance levels so that you aren’t caught off guard when one level breaks. These can be done utilizing different indicators and different time frames. It’s especially important to note when price levels overlap across multiple indicators. For example, XYZ has a very strong support at $37.50 as it overlaps the daily 200-period moving average, 15-minute 5-period moving average and the 0.618 Fibonacci retracement level.
Always Factor in Support and Resistance Levels into Your Trading Plan
You should always be aware of a stock’s support and resistance levels before you enter a trade. Understanding these levels can eliminate some of the uncertainty that comes with trading.
What are the support and resistance levels that are relevant to your trades? How will you react if a stock holds support? How will you react if a stock breaks support?
Answering these questions in advance can make trade management easier.


