What is VWAP?
You’ve likely heard the term VWAP used by traders and chartists. This refers to a moving average indicator called the volume weight average price (VWAP). This useful indicator is used by retail traders, institutional traders and market makers in several different ways. The VWAP is displayed as a moving average line on a chart. The line is a moving average that tracks the price value traded over the total volume usually on an intraday chart.
How is VWAP Calculated?
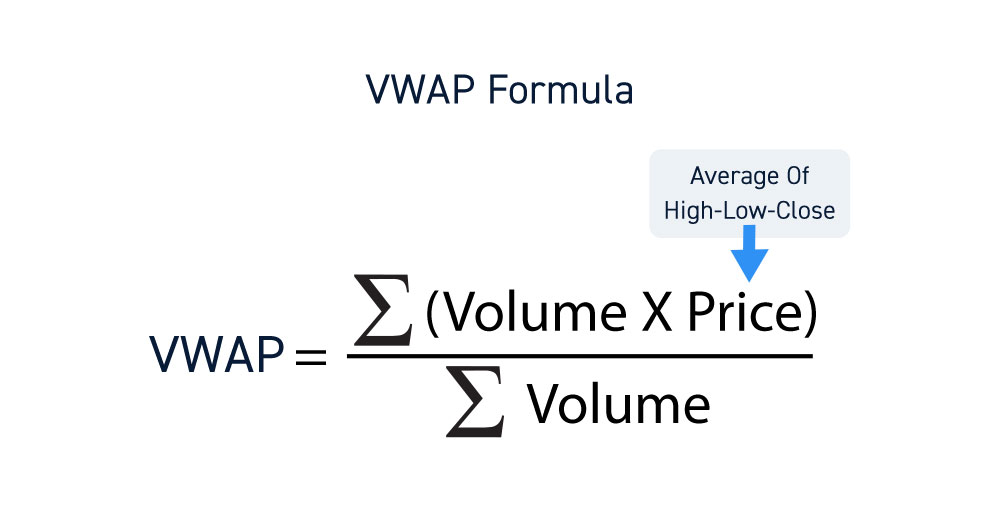
The VWAP is calculated (automatically) by taking the average of the high, low, and close for the time period and then weighting that average price by the total volume traded for that period. As the day goes on, you would need to continue to keep updating the formula for each time period to derive the VWAP line throughout the day. This can be tedious and thus most trading platforms will automatically calculate the VWAP as an indicator throughout the day.
Why Is VWAP Used?
For intraday traders, the VWAP is often used as a trend indicator. For money managers and institutions, it’s often used as benchmark price value to gauge the quality of executions from their traders or market makers. Hedge funds and algorithms will embed VWAP into their trading systems for various strategies. VWAP is widely followed and that in itself can make it a self-fulfilling factor of importance.
What is Anchored VWAP?
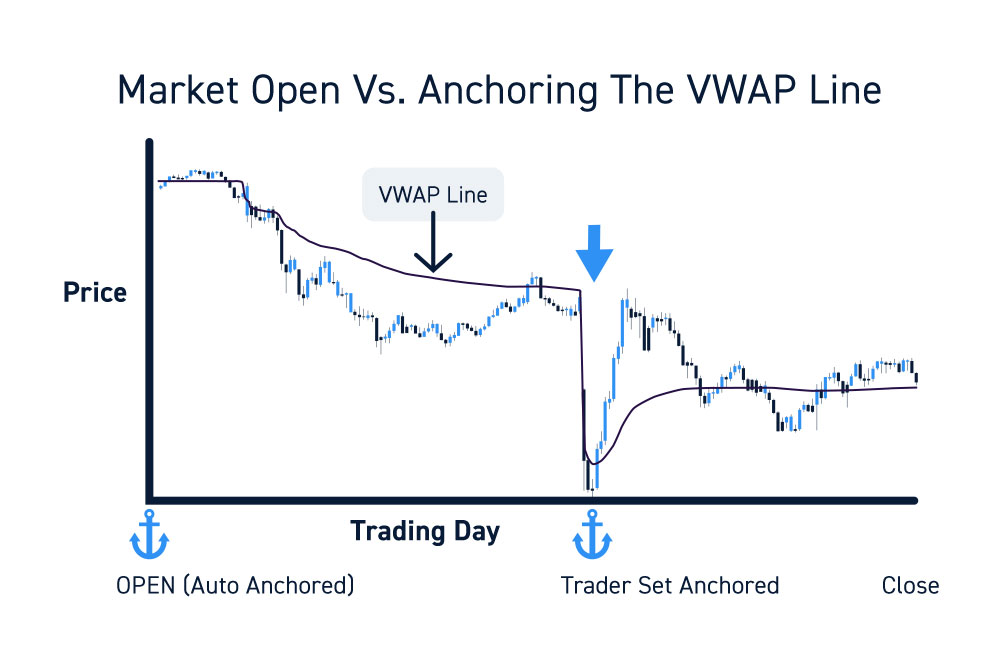
The VWAP is constantly calculated from the start of the market open to the close. For any number of specific reasons, a trader may want to specify the starting point to start calculating VWAP at a different time other than the open. This is where an anchored VWAP is used. An anchored VWAP starts calculating from a selected starting period by the user. There’s a number of reasons for using an anchored VWAP like trying to normalize a price due to a large price gap up or down.
How to Use VWAP
Most platforms have the VWAP indicator which is usually displayed as a moving average trend line. It’s important to check for the indicator on your specific brokerage charting platform as part of the ‘how to set-up on your charts’. The typical timeframe will be intraday starting off the opening trade. Keep in mind that VWAP works best when there is plenty of volume.
Most charting platforms usually provide the VWAP indicator on the charts.
Anchored VWAP vs. VWAP
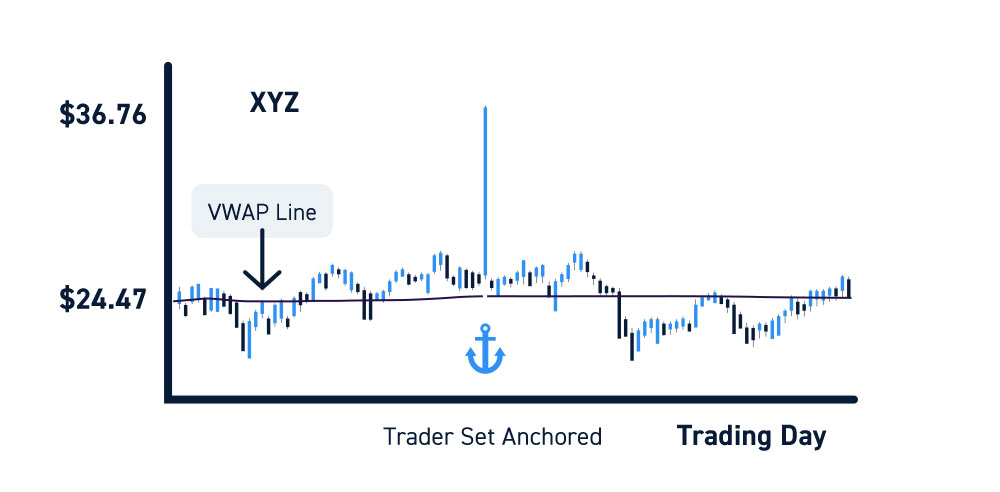
Normally, the regular VWAP is sufficient for intraday trading. The anchored VWAP can be considered if there is a large irregular trade on the time and sales or a large gap up or down. For example, if XYZ is trading at $24.47 and then a trade comes in at $36.76 then back to $24.46, then you might consider an anchored VWAP is you can’t edit out the irregular trade.
Typical Timeframes
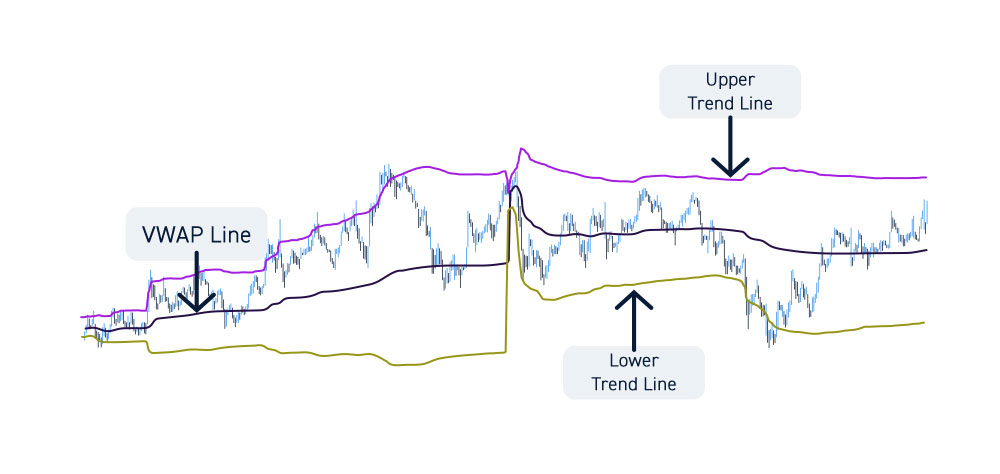
The VWAP is typically used intraday with the default settings. Many VWAP indicators also come with an upper and lower trend line that is similar to a Bollinger Band. The intraday time frame VWAP value can change depending on the time frame of the chart. A 5-minute or 15-minute VWAP is typical when trading intraday to illustrate the trend.
Why is VWAP Important?
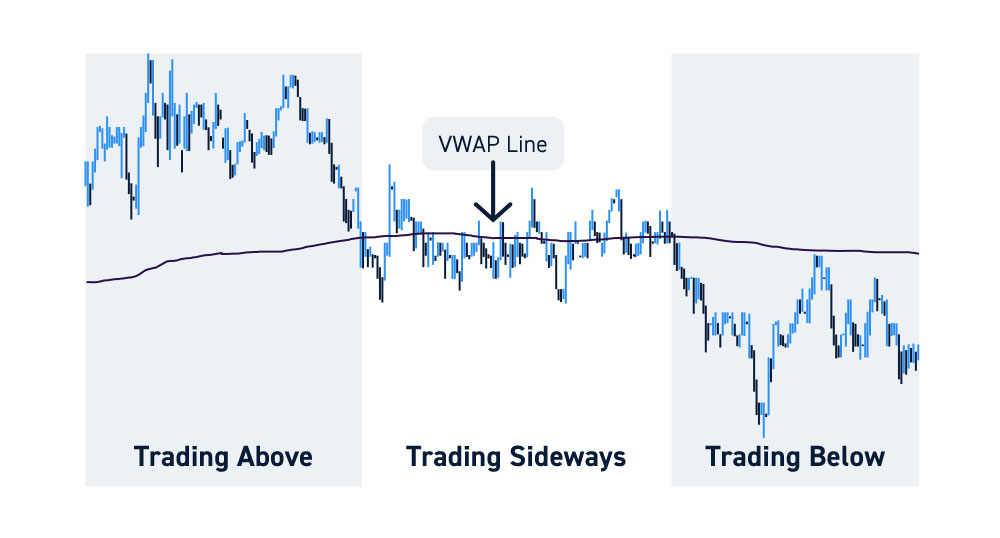
The VWAP indicator is significant for the purposes of its use. It provides a context of the price trend depending on where the stock is trading (above or below) in relation to the VWAP line. A stock trading above the VWAP as the line rises indicates an uptrend and vice versa on a downtrend. For example, if stock XYZ has a falling VWAP line, then you may want to wait for the stock price to pierce the VWAP and reverse back up to play with the trend. VWAP provides a visual basis for supply and demand based on its relation to the stock price and the direction of the trend.
Popular Indicator
Since VWAP is such a popular tool utilized by traders, it can often have characteristics of a self-fulling prophecy. If a stock is trading higher but still under the VWAP, traders may anticipate the test of the VWAP and step into a long position targeting the VWAP. As traders jump on board trying to get ahead of the next trader, the stock may naturally rise towards the VWAP. On the flipside, bears that expect a rejection at the VWAP may place their limit orders to short-sell the stock at the VWAP expecting profit takers and more sellers to come in. The VWAP is most useful when combined with other indicators or with a trading methodology.
Used by Institutions
Institutions and fund managers may use the VWAP to gauge the quality of their order fills. If they are constantly getting filled above the VWAP, it may cause the manager to seek other market makers or traders to carry out the order fills. Institutions may want to get into a position, but the price at which they get in can make a market impact. The VWAP is also used to gauge the liquidity and market impact of institutional orders. If the trader is recklessly filling orders, then it will cause shares to rise triggering a chasing element to the fills and a potential steep drop once the orders are filled.
How to Trade With VWAP
There are many ways to trade with the VWAP. Again, it works best when combined with other complementary indicators including momentum indicators like MACD or stochastic.
Support/Resistance
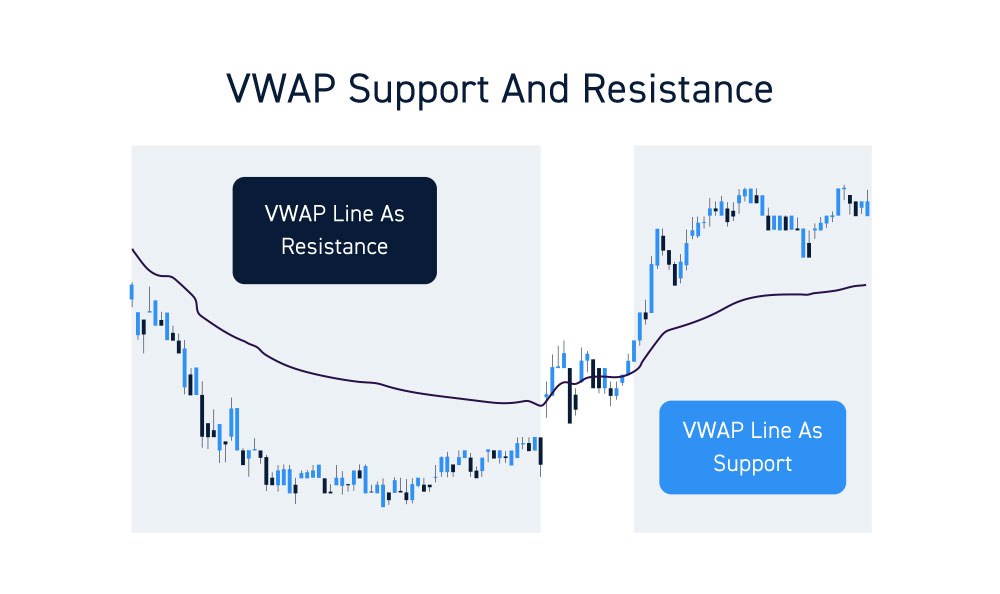
One of the simplest uses of the VWAP is gauging support and/or resistance. It’s a simple line (VWAP) that acts as a support if the stock is trading above it and a resistance if the stock is trading below it. The direction of the VWAP line is the indication of the trend thereby using it as a de facto trend line.
Entry and Exit Levels
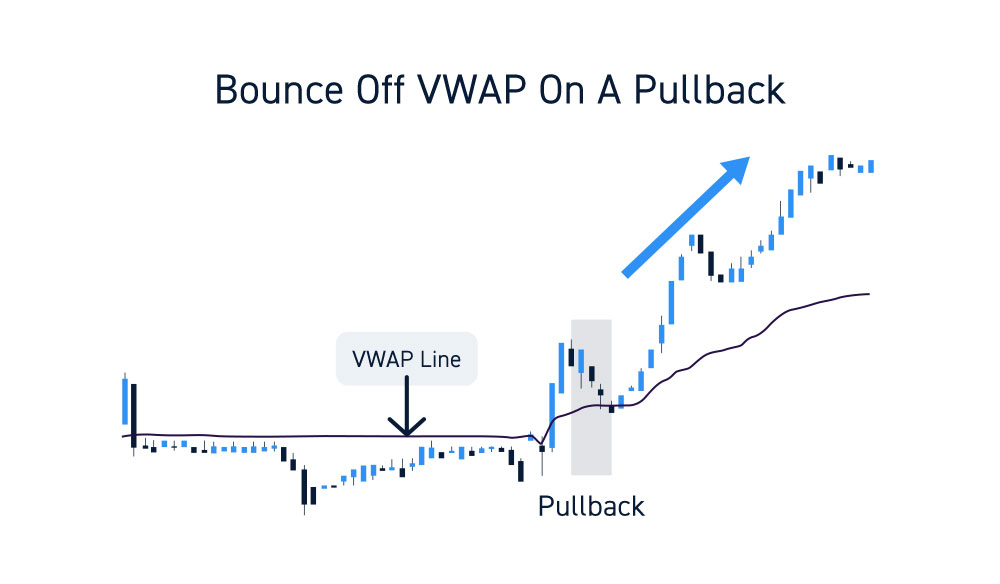
One trader’s support is another trader’s resistance. In other words, a trader who is long a stock can use the VWAP as a target exit if its trading below. Traders looking to take a long position can wait for the stock to breakout through the VWAP for longs or pullback and bounce off VWAP on pullbacks. The VWAP makes for a great entry and exit area. If you also have the accompanying higher and lower envelopes, these can be used for entries back towards the VWAP.
Gauge Relative Strength
A stock trading over intraday VWAP may be bullish, while a stock trading under may be bearish. A quick glance at the chart immediately provides you a gauge of relative strength or weakness. When you combine the VWAP reading for benchmark indexes and peer stocks, it enables you to compare and gauge whether your stock is exhibiting relative strength or weakness. It also enables you to think through your trade more thoroughly. For example, shorting a stock that is uptrending and trading above its VWAP makes it susceptible to a short-squeeze as you are trading against the trend. Whereas, shorting a stock that is downtrending and trading below the VWAP enables you to trade the relative weakness aligned with the trend.
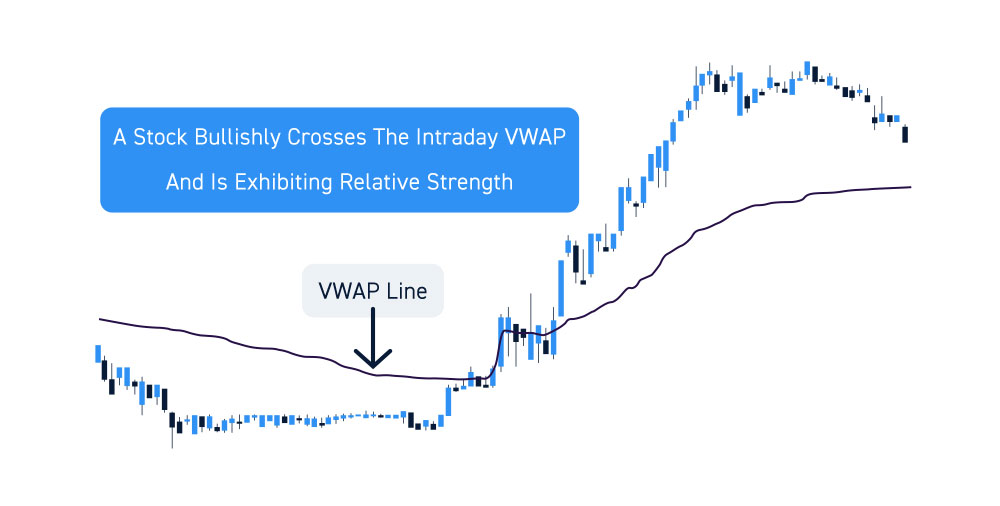
Trade VWAP Price Crosses
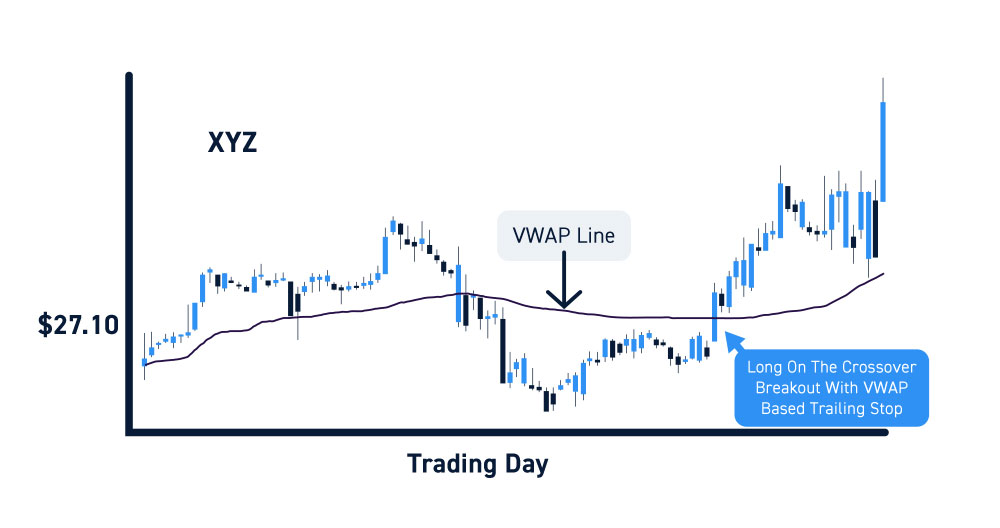
When the underlying stock price crosses the VWAP up from below, it can represent a breakout. This can be a signal to go long the stock. If a stock falls below the VWAP, it could signal a short-sell trade as it breaks down. The VWAP also makes for a good stop area if the support is broken. For example, you may plan on entering XYZ on a breakout through $27.10 which is the VWAP and place a trail stop $0.20 below the VWAP. This enables you to devise a quantifiable game plan for your trade. Remember, the VWAP works best when combined with complementary indicators, especially momentum indicators.