

Many traders have an affinity for prioritizing technical analysis to interpret price action utilizing stock charts. One of the most popular technical indicators that traders use are Bollinger Bands (BBs). These indicators provide multiple functions and are commonly available on most charting and trading platforms to assist traders in making better trading decisions on underlying stock prices.
What Are Bollinger Bands?
Bollinger Bands are a technical indicator or technical study added to stock charts to visualize price ranges. They were created by John Bollinger in the 1980s and are commonly available on most charting software and trading platforms.
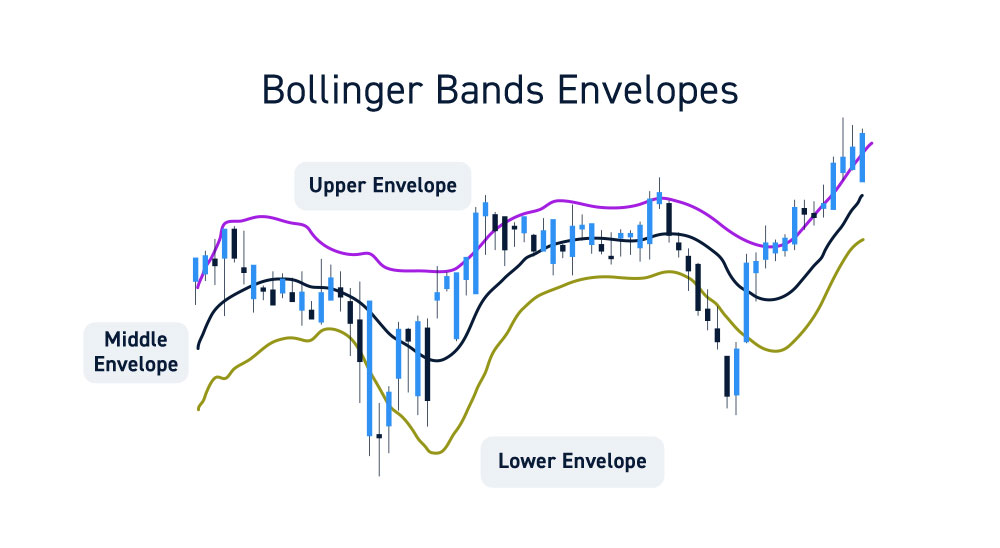
Bollinger Bands display three moving average lines referred to as “envelopes”.
The upper envelope indicates the upper nominal price range, the lower envelope indicates the lower nominal price range. The middle moving average is represents the midpoint and potential trendline support and resistance.
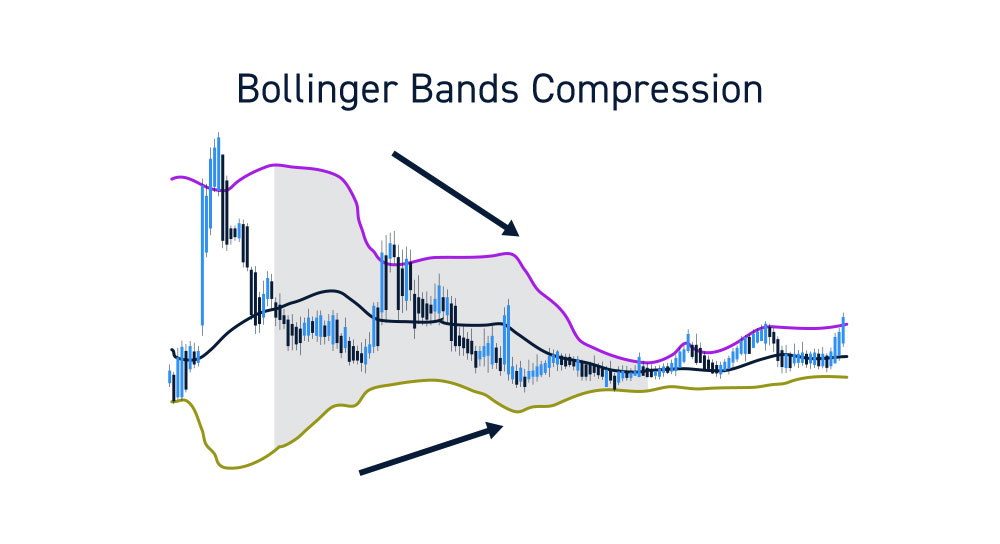
When watching the context of all three bands, Bollinger Bands also visualize periods of price range compression and low volatility that precede periods of price range expansion and higher volatility.
Why Use Bollinger Bands?
Bollinger Bands provide price behavior information that diligent traders can use for trend, support, resistance and volatility analysis.
The trader mindset should embrace a discovery mode rather than trading mode when initially using Bollinger Bands, or any new indicator. This means rather than try to trade right off the bat using BBs, first seek to discover the information they are providing. Only after gauging the functional mechanics of Bollinger Bands can traders convert the information into knowledge that can be used for trading purposes.
The usual configuration is set at 20-periods and 2.0 standard deviation. During extreme volatility periods, a 2.618 standard deviation setting can be more effective. Here’s some of the price information that can be derived with Bollinger Bands.
Support and Resistance
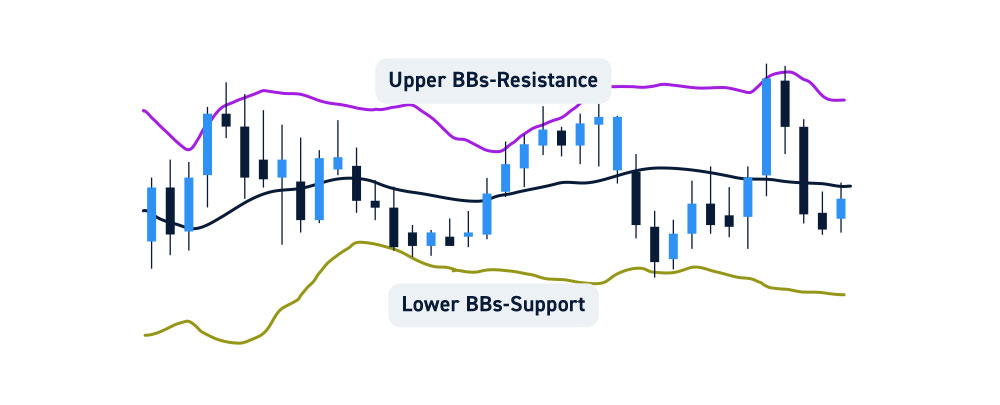
The rule of thumb with any price indicator is simple. If a stock’s price is above the indicator, then the indicator is used as support. If the stock’s price is below the indicator, then the indicator is used as resistance. Applying this simple concept to BBs means that upper BBs tend to be the resistance and lower BBs tend to be support. The middle BB act’s as a support if prices hold above it and resistance if prices remain below it.
Trends
The direction of the middle BB can be used as the direction of the trend and the baseline support on uptrends and downtrends.
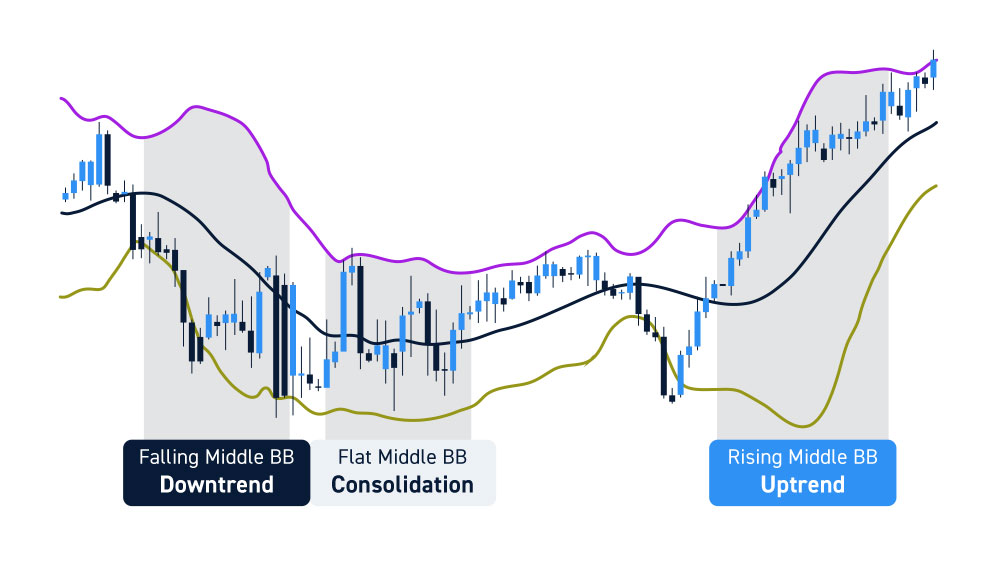
Uptrends have a rising middle BB with rising upper BBs and rising or expanding lower BBs.
Downtrends have falling middle BBs with falling lower BBs and falling or expanding upper BBs.
Consolidation is illustrated by a flat middle BB and flat to compressing upper and low BBs. Consolidation precedes a breakout which precedes an uptrend or a breakdown which precedes a downtrend. Each Bollinger Band has a dynamic price value that updates with the close of each period.
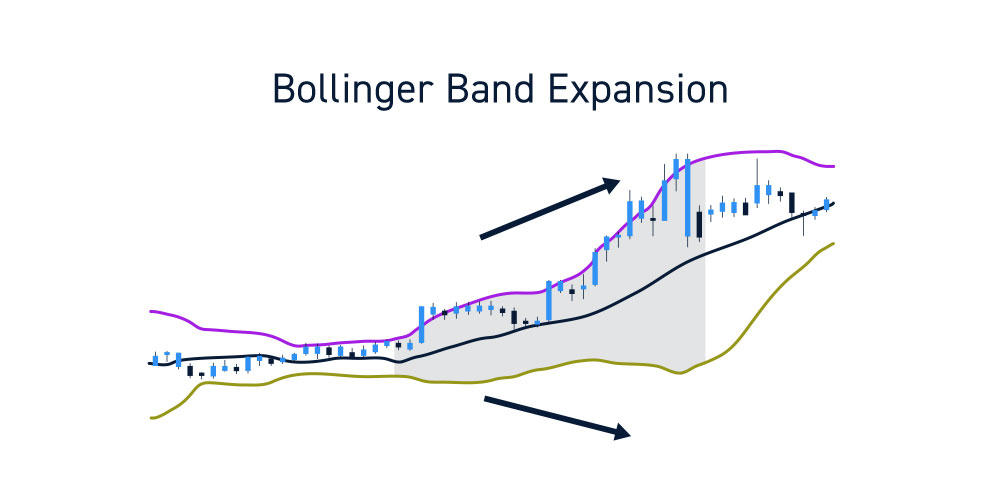
Compression and Expansion
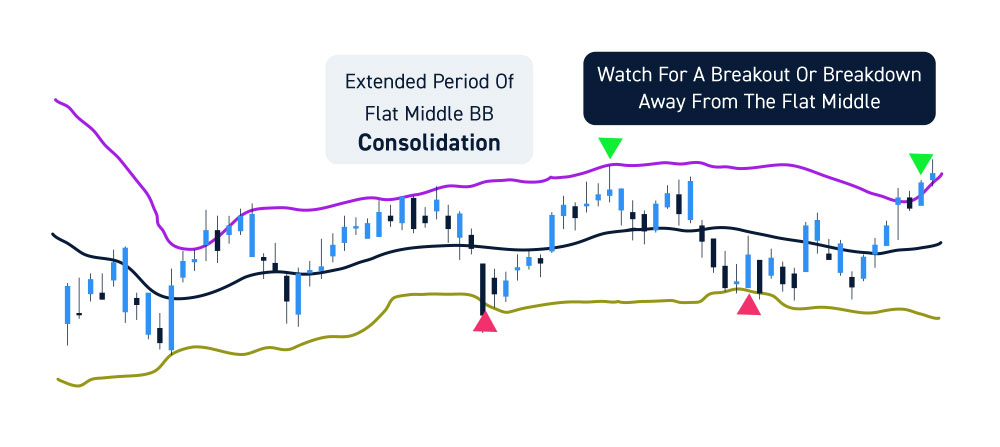
Bollinger Band compressions are an indication of a tightening price range indicating a consolidation and illustrated by both upper and lower BBs turning inwards. This means upper BBs slope down while lower BBs slope up. This indicates low volatility and a compressing price range, which builds steam and precedes an expansion.
Bollinger Band expansions indicate price expansion as the price range breakout or breakdown triggers ahead of an uptrend or downtrend.
How to Use Bollinger Bands
Bollinger Bands should be use in conjunction with other indicators as part of a complete trading methodology. Here are some trading functions and strategies that can implemented with the information derived from BBs.
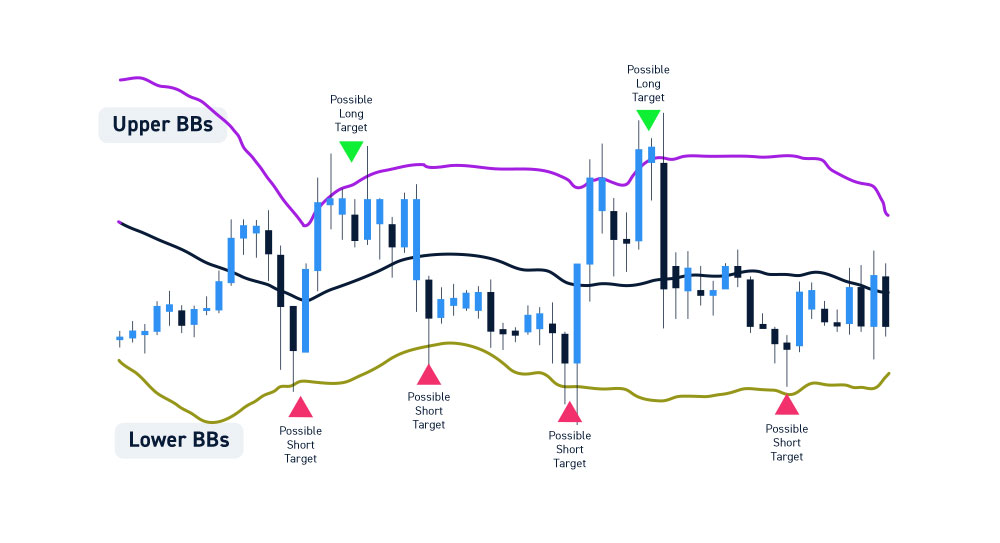
Bollinger Band Based Price Targets
Traders in a long position can utilize the upper BBs as upside targets to trim some or all exposure. Since the upper BBs tend to be near-term tops, they are effective profit taking price levels selling into strength. The same applies on shorts utilizing the lower BBs as profit targets to cover some or all of the short position. During Bollinger Band expansions, traders can utilize the middle BB as a trail stop which utilizing the upper and lower BBs as profit taking areas.
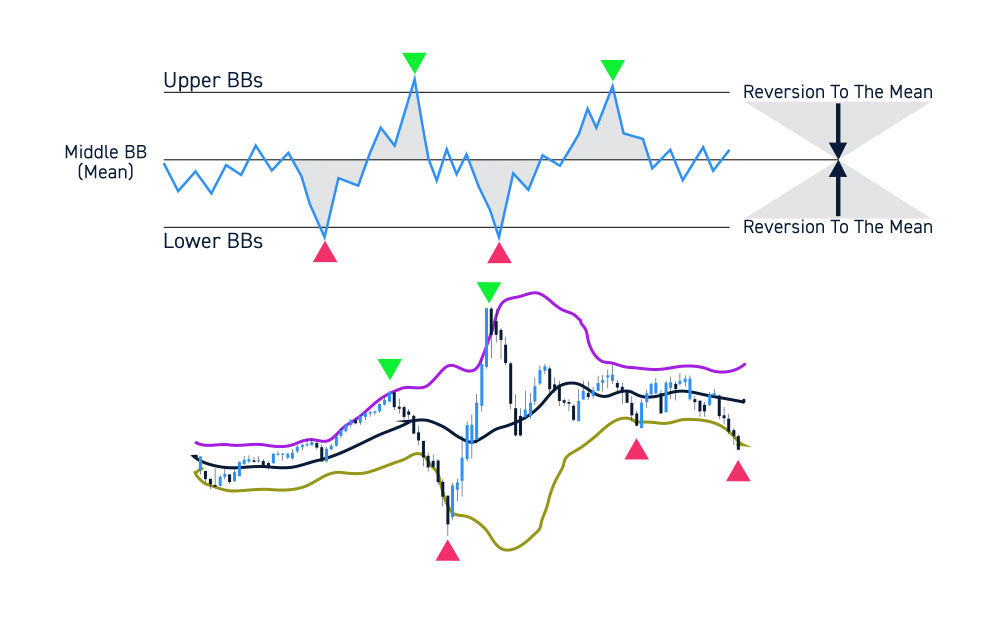
Bollinger Band Upper and Lower Envelope Reversions
On the flipside, countertrend trades can be made off the upper and lower BBs if there is enough “meat on the bones”, meaning enough of a price differential from the upper or lower envelope to the middle BB. Be careful if the channel range is small between the middle and upper or lower BBs. Reversion trades should only be player when the ranges are wide enough to justify the risk.
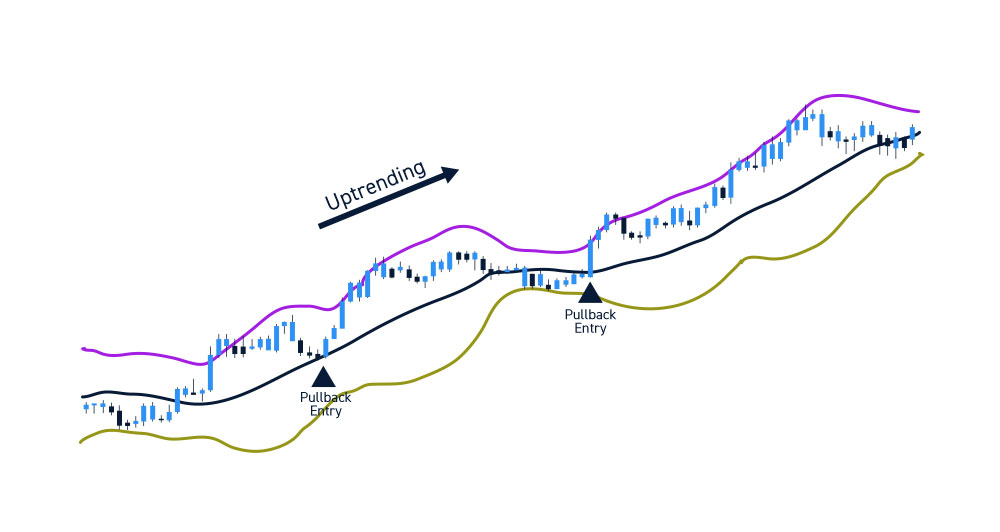
Bollinger Band Trend Entries
If a stock is uptrending, the middle BB can be used as a pullback entry on uptrends or a pullback entry on shorts in downtrends. It’s prudent to wait for the reversion and deflecting off the middle BB before pulling the trigger. If the middle BB breaks, then a reversal is possible, so patient is crucial to let the market first test the durability of the trend by deflecting the reversions off the middle BBs first.
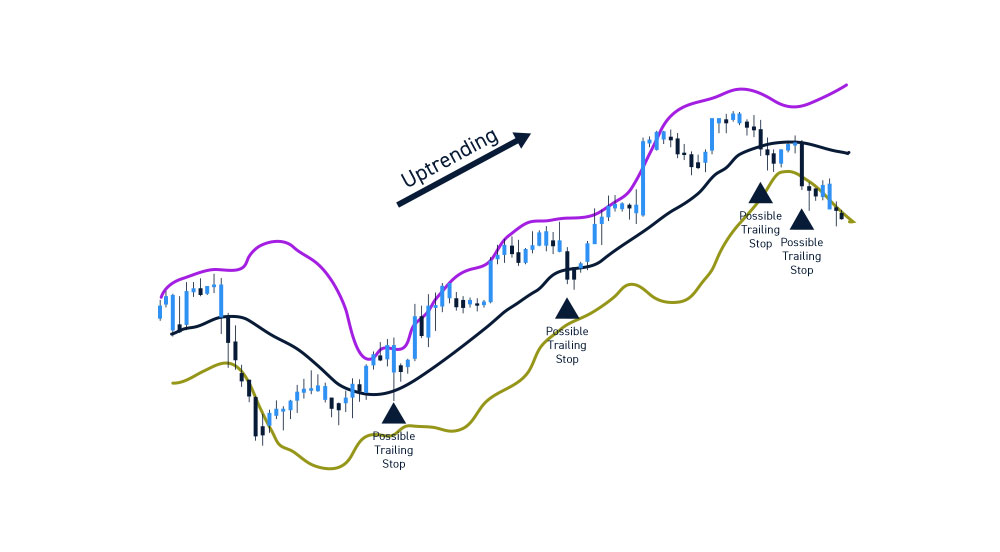
Bollinger Band Stop-Losses
If a long position is initiated, the upper BBs can be used to trim profits, but the middle or lower BBs can be used as trailing stop losses as well. The same applies during downtrends, where shorts can be covered at lower BBs while utilizing the middle BB or upper BB as a trail stop on the rest of the short position.
Be Careful with Conventional Statistics Claiming Indicator Inefficiency
It’s easy to find information on the internet regarding “studies” and back-testing results that conclude how a technical indicator was found to be inconclusive, inconsistent and ineffective. This is a common mistake with various so-called “analysis” that attempt to validate the usefulness of Bollinger Bands (or any technical indicator) with sophomoric back-testing that assigns rudimentary buy and sell triggers without taking market context into the equation.
A clinical approach falls short when compared to firsthand experience that adapts to market context. Bollinger Bands alone are not and should not be the basis of a trading methodology. They should be a component of an overall trading strategy, one tool of many to take on the markets.


