Successful trading relies on having good information about the market for a stock. Price information is often visualized through technical charts, but traders can also benefit from data about the outstanding orders for a stock. This type of data is known as Level 1 and Level 2 market data.
Level 1 data is often available for free, but most data providers require traders to pay for Level 2 market data. In this guide, we’ll explain the differences between Level 1 vs. Level 2 market data and highlight the potential benefits of Level 2 data for traders.
What is Level 1 Market Data?
Level 1 market data is the price information that most traders and investors are already familiar with. It includes the national best bid and ask prices for a stock plus the number of shares that traders are trying to buy or sell at those prices.
For example, a Level 1 quote might show a stock’s price as $10 per share, with a bid price of $9.90 and an ask price of $10.10. The bid size of 500 shares and the ask size of 250 shares. Level 1 market data also includes the price and size of the last transaction made for that stock.
What is Level 2 Market Data?
Level 2 market data includes everything in Level 1 data, but it offers more information about outstanding limit orders that have been placed below the national best bid and above the national best ask.
For the example above, Level 2 market data could show bid prices ranging from $9.00 to $9.90 and the number of shares in outstanding orders at each bid price. Similarly, Level 2 data could include ask prices ranging from $10.10 to $11.00 and the number of shares in outstanding orders at each ask price.
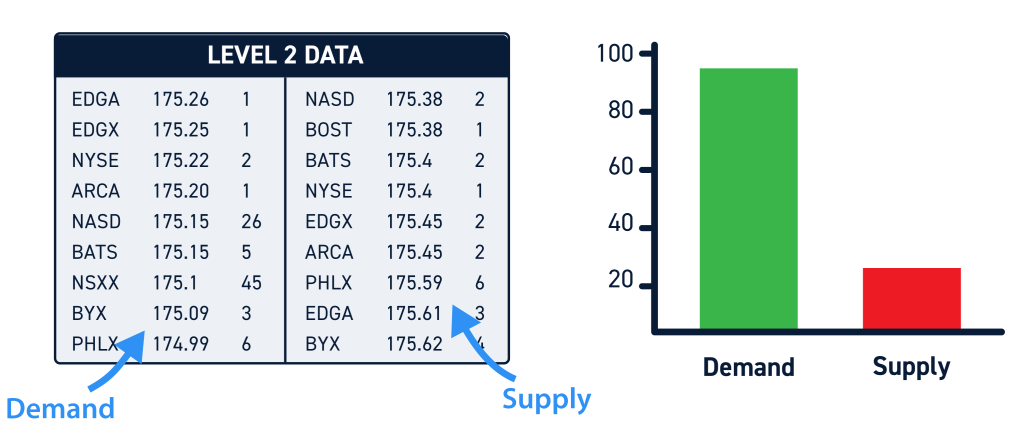
Since Level 2 market data shows the full spectrum of outstanding buy and sell orders around the current best bid and ask prices, this type of data is commonly referred to as market depth or order book data.
Benefits of Level 2 Market Data
The details provided by Level 1 quotes are mostly useful for long-term investors who want to know if current bid and ask sizes are sufficient for their order to be fulfilled at the quoted price. If bid or ask sizes are smaller than the trades that investors are trying to place, they may consider using a limit order.
However, Level 1 data provides very little information for active traders. It leaves out a lot of information about the current market for a stock and isn’t often used for trade analysis or decision-making for active trading.
Level 2 data, on the other hand, offers a significant amount of information to active traders trying to decide when to enter and exit trades. Here are a few of the ways in which Level 2 market data can be used for trading.
More Accurate Supply and Demand Data
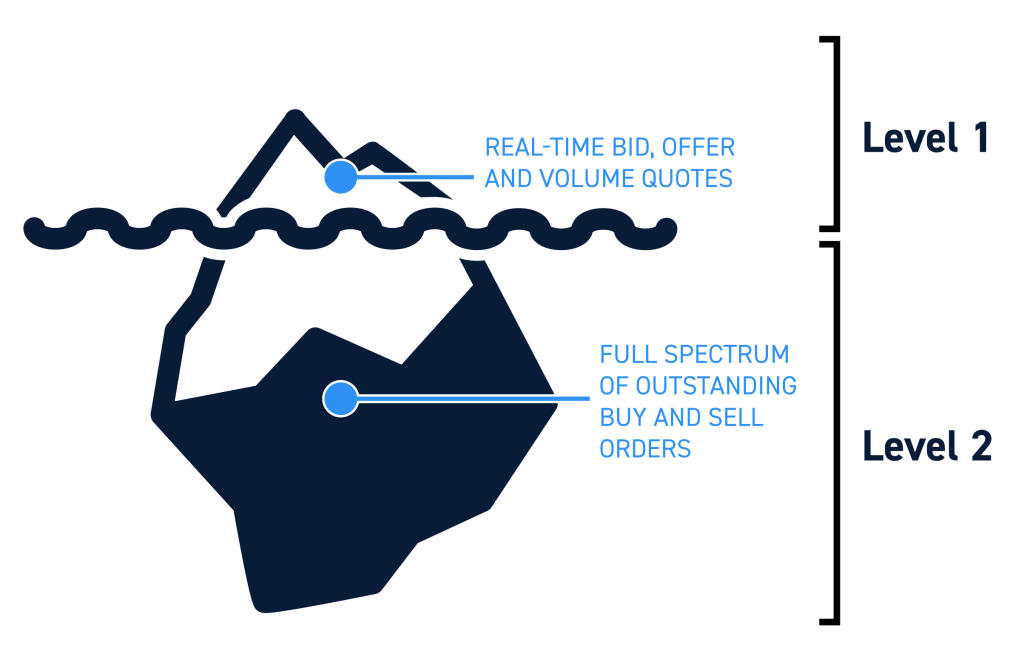
Level 2 data provides a much fuller picture of the market for a stock than Level 1 data. Level 1 data only shows the current best bid and ask prices – the trading equivalent of seeing just the tip of an iceberg.
Level 2 data shows all of the outstanding orders around the current stock price. It provides traders with much more information about the potential supply of a stock that could be released if the price rises or the potential demand for a stock that could snap into place if the price falls.
Importantly, Level 2 data doesn’t capture every outstanding order. Some types of orders, including direct sales and dark pool orders, don’t show up in Level 2 market data. Traders should keep this in mind when using Level 2 data.
More Accurate Liquidity Data
Level 2 data typically includes the size of outstanding orders at every displayed bid and ask price. That allows traders to clearly see how liquid a stock is likely to be at each of these price points.
Getting information about liquidity at different price levels is especially important for traders who are moving large volumes of shares in low-liquidity stocks, such as penny stocks. Savvy traders can use Level 2 market data to time or price large orders to minimize the impact on the market price while in the process of fulfilling their trade.
Shows Significant Price Areas
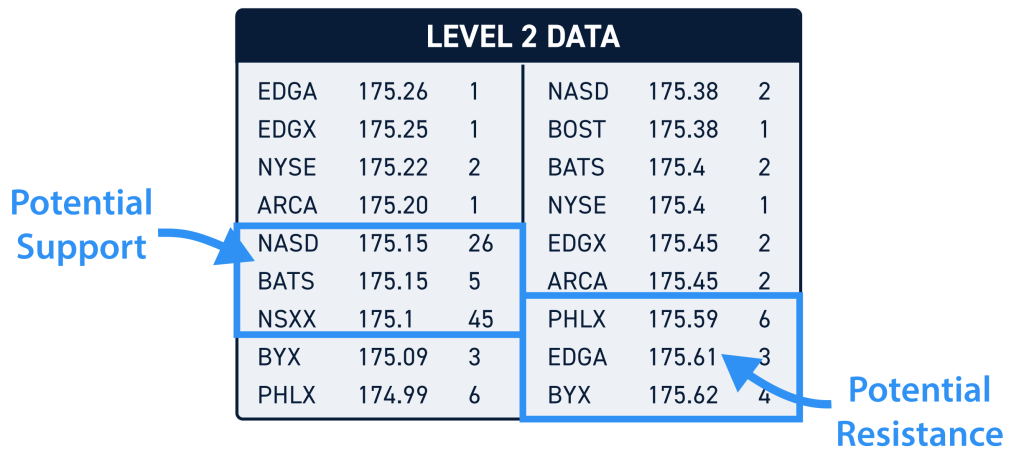
Another benefit of using Level 2 market data is that it can help traders identify areas of support and resistance before they show up on a price chart. In Level 2 data, price levels that show high outstanding demand or high outstanding supply are likely to serve as support or resistance levels in the future.
As an example, say that a stock has a current best bid price of $9.90 with 100 shares outstanding. There are outstanding orders for 100 shares at $9.80 and 100 shares at $9.70, but outstanding orders for 800 shares at $9.60. This suggests that there is strong demand for the stock at $9.60, and this demand is likely to create support if and when that price level is reached.
Traders can plan around these potential support and resistance levels. However, it’s important to monitor Level 2 data to ensure that outstanding orders do not change significantly before the relevant price levels are reached.
Shows Which Market Makers May be Controlling a Stock
Level 2 market data also includes the market maker ID of each market maker responsible for quotes. In the case of small-cap stocks, there is often one market maker that handles an outsized portion of trading volume. Monitoring Level 2 data is a good way to identify the key market maker for a particular stock.
That’s important because different market makers behave differently. Some spoof orders or try to hide large orders. Some allow the price for a stock to move quickly in either direction, while others try to slow down price movements. Understanding which market maker controls trading for a stock and how that market maker tends to act can help traders plan out their trades.
Conclusion
Level 2 market data provides a much more comprehensive picture of the current market for a stock than Level 1 data. Level 1 data only offers information about the current best bid and ask price for a stock, while Level 2 data shows information about outstanding orders at a wide range of bid and ask prices.
Using Level 2 data, traders can more accurately predict liquidity at different price points, identify support and resistance levels before they appear on a price chart, and identify the market makers responsible for most trading activity in a stock.