

Level 2 data is important for traders because it shows the full range of open orders for a stock, not just the current best bid and ask price. Using Level 2 data, you can identify potential trades before they become apparent on technical charts or get additional information about a trade you have planned.
In this guide, we’ll take a closer look at Level 2 data and explain ways to interpret Level 2 data for stock trading.
What is Level 2?
Level 1 stock data only shows the current best bid and ask price for a stock as well as the sizes of the orders at those prices. Level 2 stock data shows all of the orders that have been placed at prices below the best bid price or above the best ask price. These are limit orders that could be executed if the price of a stock were to fall or rise.
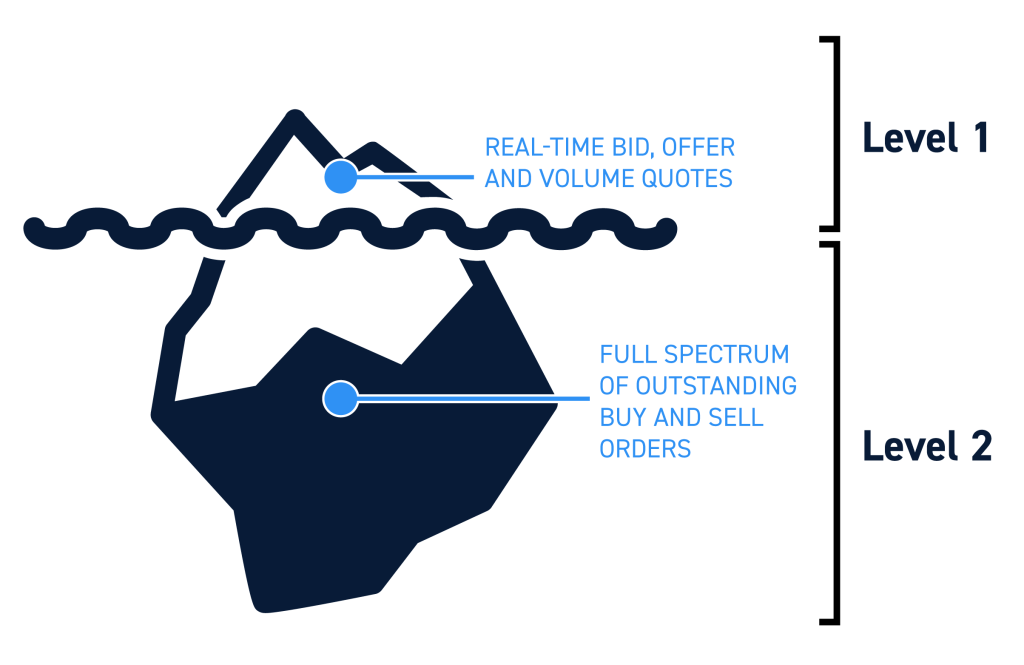
Level 2 data is also known as order book or market depth data because it reveals the full range of existing orders for a stock.
Components of Level 2
There are three key components that make up Level 2 data:
Market Maker ID
The first component of Level 2 data is the ID code of the market maker that is responsible for a quote. This is a four-letter code that corresponds to a specific market maker, which is often an institutional trading desk.
Knowing what market maker is responsible for providing quotes can help you identify patterns in how a stock is traded. Particularly for low-liquidity stocks like penny stocks, there may be one market maker that is responsible for most of the volume in that stock.
Price
Level 2 market data shows the price of the quote offered by each market maker. These bid and ask quotes are below and above the current national best bid and ask prices and are shown at regular intervals. For example, if a stock’s national best bid price is $10.00, Level 2 data may show quotes at $9.90, $9.80, $9.70, and so on.
Size
Each quote is accompanied by the size of the order – that is, the number of shares to be traded by that market maker at that price. Size data reflects the current order book for each market maker and does not necessarily indicate the number that will be traded at that price. Orders can be cancelled prior to execution or market makers may be unable to fulfill their entire trade at the quoted price.
How to Interpret Level 2 Data
Before we dive into how to interpret Level 2 data, we need to cover some important caveats.
First, keep in mind that not all orders show up in Level 2 data. Large institutional investors often hide large orders by using ECNs. They can also split up large orders into blocks, releasing each block to market makers only after the previous block trades. This is known as an iceberg order.
In addition, Level 2 data can be manipulated. For example, a trader may place an order to buy 1 million shares of a stock at a specific price, causing traders looking at Level 2 data to believe there is support for the stock. The trader can then cancel that order before it executes.
All of this means that there is no perfect way to interpret Level 2 data. You need to be wary when using Level 2 data and you should always use this data alongside other trade indicators like technical charting etc…
With that in mind, let’s look at some of the ways traders can use Level 2 data.
Analyze Supply and Demand
One of the simplest and best uses of Level 2 data is to analyze supply and demand for a stock. Level 2 data can show whether there are more outstanding orders to buy a stock or sell a stock at prices around the current best bid and ask. This offers a clue as to whether bulls or bears are likely to drive a stock’s price.
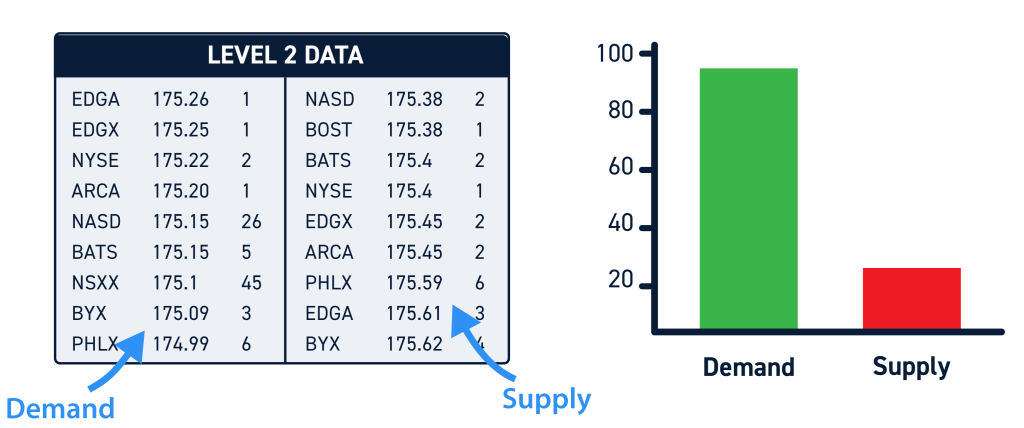
In addition, Level 2 data shows how much liquidity there is for a stock at different price levels. Larger outstanding order sizes typically mean that a stock is more liquid. This is especially important if you are placing trades for a large volume of shares since you need to know whether there is enough liquidity to fulfill your trade at the intended price.
Even if you aren’t likely to have issues getting your trades filled, knowing whether a stock has low or high liquidity is important. Stocks with low liquidity tend to be more volatile, and you need to be prepared for this when trading.
Identify Price Areas of Interest
Another way to use Level 2 data is to identify potential areas of support and resistance for a stock. To identify support and resistance levels, look for unusually large order sizes at a particular price level. For example, say a stock that normally trades in lots of 1,000 shares shows an outstanding order for 100,000 shares at a particular price. That’s an indication that the stock may hit support or resistance at that price.
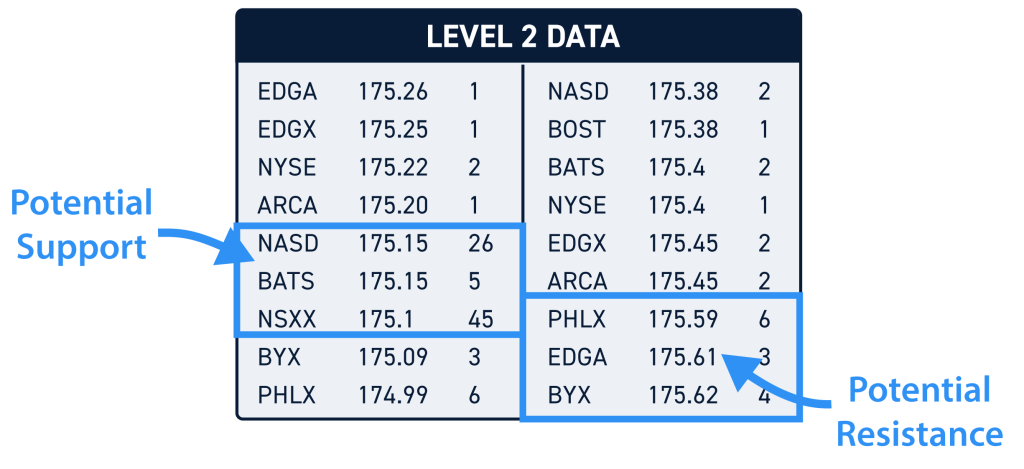
Be cautious when using Level 2 data to identify support and resistance levels. It may appear that there is a large order at a particular price, only for that order to disappear as the stock approaches that price. Support and resistance levels identified using Level 2 data could be corroborated with technical charts.
Incorporate Time & Sales
Traders may be able to get deeper insights by combining Level 2 data with Time & Sales data. Whereas Level 2 data shows open orders, Time & Sales data shows executed orders.
So, you can use Time & Sales to see what orders that showed up in the Level 2 data stream were actually executed. You can also see what hidden orders were executed without showing up in Level 2 data. You may be able to identify patterns around which market makers dominate the market for a stock or use a greater proportion of spoofed orders.
Conclusion
Level 2 data can be a useful tool for analyzing supply and demand for a stock and for identifying potential support and resistance levels. It can also be combined with Time & Sales data for more information about how a stock is being traded. Keep in mind that Level 2 data isn’t perfect and should always be analyzed in conjunction with technical charts or other indicators.


