In this article, we’ll be detailing the inverse version of the well-known head and shoulders chart pattern so you can start effectively incorporating it into your trading.
An inverse head and shoulders pattern is a technical analysis pattern that signals a potential trend reversal in a downtrend.
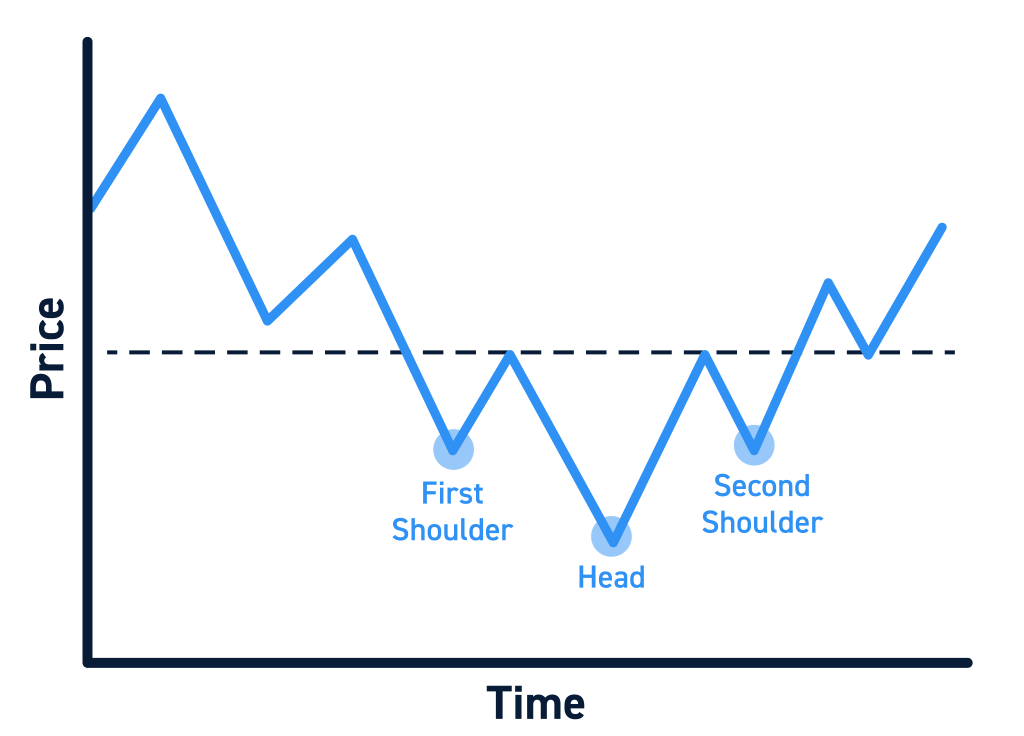
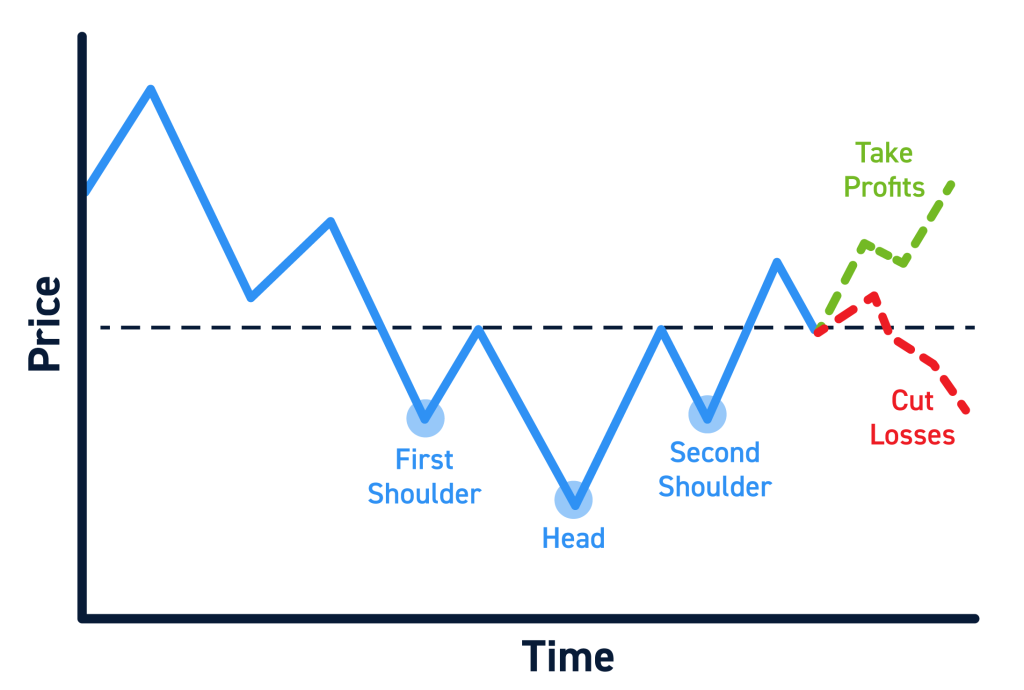
This pattern is formed when an asset’s price creates a low (the “left shoulder”), followed by a lower low (the “head”), and then a higher low (the “right shoulder”).
Following this formation is a bullish breakout above the resistance line connecting the two shoulders, known as the neckline.
The psychology behind this pattern is that as the price rises to the resistance level, bears (sellers) are becoming less aggressive and bulls (buyers) are becoming more aggressive, leading to a reversal in trend after the breakout.
Using this strategy should always incorporate your own experience and risk management in regards to entries, exits and stops.
Components of an Inverse Head and Shoulders Pattern
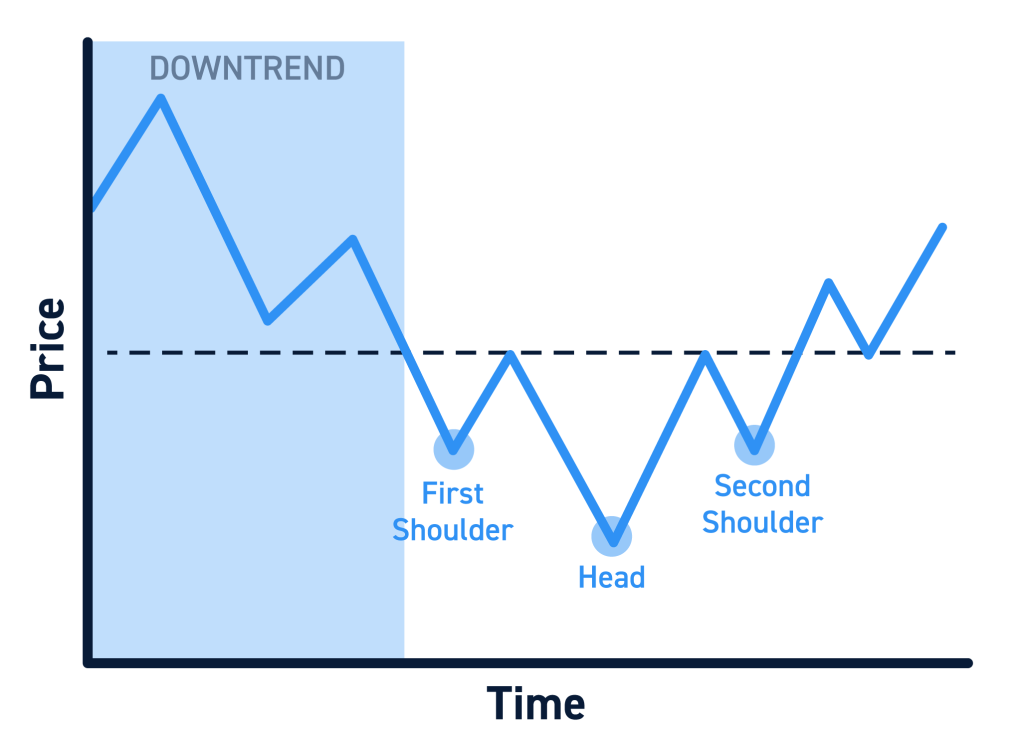
Lead-in Downtrend
The first component of an inverse head and shoulders pattern is a lead-in downtrend, which is a clear downward trend in the price of the asset. This downtrend is typically characterized by a series of lower lows and lower highs.
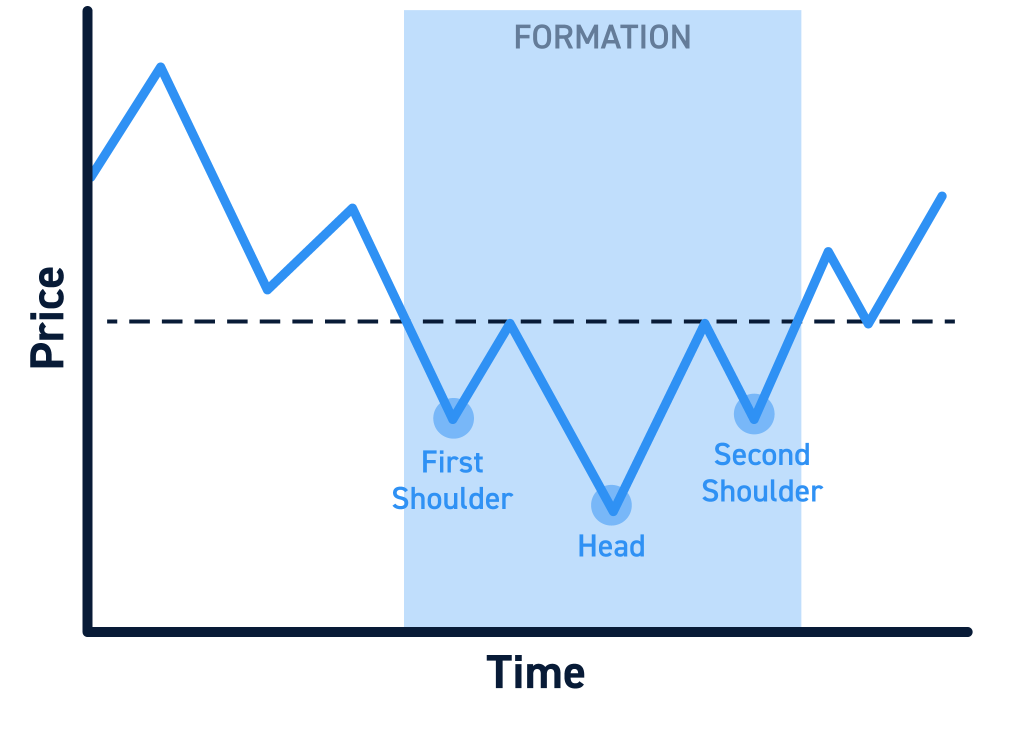
Inverse Head and Shoulders Formation
The second component is the inverse head and shoulders formation, which is formed when the asset’s price creates a low (the “left shoulder”), followed by a lower low (the “head”), and then a higher low (the “right shoulder”). This formation creates a resistance level (neckline) connecting the two shoulders.
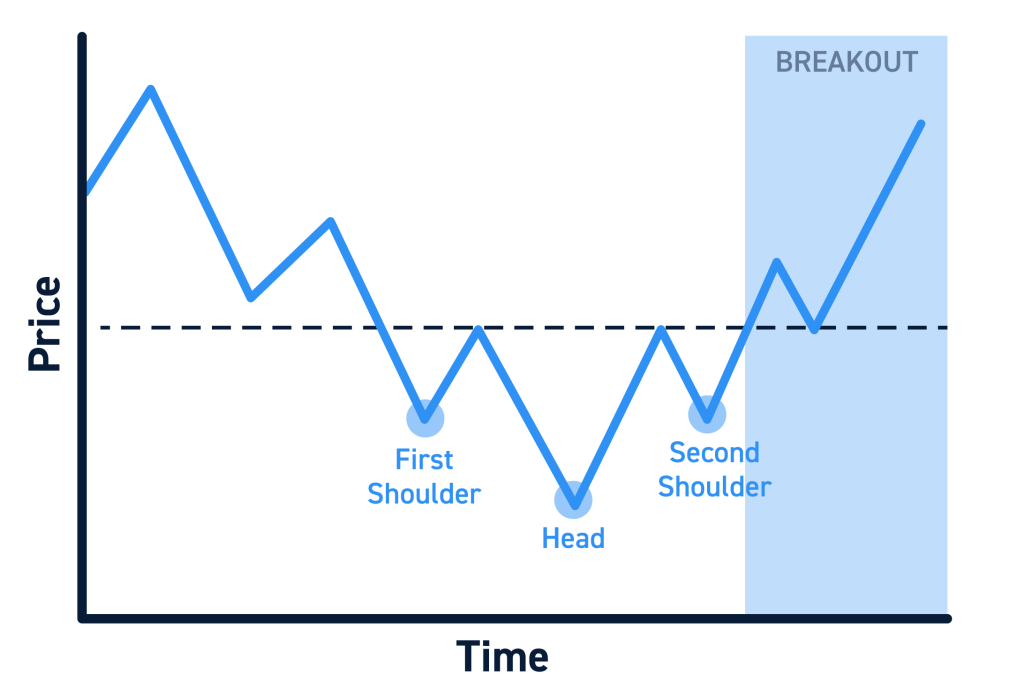
Reversal Breakout (Neckline Resistance)
The final component is the reversal breakout, which occurs when the price of the asset breaks above the resistance level created by the neckline. This breakout signals a potential trend reversal, as the bulls have taken control of the market and pushed the price above the resistance level.
How to Trade an Inverse Head and Shoulders Pattern
Identify the Pattern
The first step in trading an inverse head and shoulders pattern is to identify the pattern. This involves looking for the lead-in downtrend, the inverse head and shoulders formation, and the potential reversal breakout above the neckline resistance.
Candlestick patterns are rarely as uniform as pictures often suggest, but formations should still be visible to a practiced eye. If you see a low followed by a lower low (the left shoulder and head), be on the lookout for that higher low (right shoulder) to potentially catch the break out before it gets away from you.
Waiting for the breakout to confirm the bullish reversal can be the safer trade, but sometimes entering while the right shoulder is forming offers the best risk-to-reward. However, traders should always be cautious trading off of still-forming patterns.
Determine the Breakout Point (Neckline)
The second step is to determine the breakout point, or the “neckline resistance.” This is the point at which the price of the asset is expected to break above the resistance level and signal a major trend reversal.
To draw the neckline, simply draw a line connecting the highs that led to the shoulder lows. Necklines aren’t always straight lines and can look more like slanted trendiness, so be aware of exactly where the breakout of the neckline would occur so you don’t join the trade late.
Once you have the neckline properly identified, you can set an alert to be notified if and when price reaches that key level.
Enter the Trade
Once the inverse head and shoulders pattern occurs, the next step is to enter the trade, which can be easier said than done. Nevertheless, buying the asset on the breakout of the neckline or on a retest of the neckline as support are ideal points of entry.
If you see price pushing beyond the breakout level with significant volume, entering at the moment can be the move, but waiting for a retest is sometimes the safer trade.
However, waiting for a retest that never happens can lead you to miss good trades on occasion. You’ll have to decide for yourself which circumstances warrant getting in on the break vs on a retest.
Exit the Trade
The final step is to exit the trade. A stop-loss should be placed reasonably below the breakout resistance in case the breakout fails to hold as support on a retest. Many traders will put their stop-loss just below the low of the right shoulder, but you can also have your stop-loss just below the low of the inverse head (waiting for an official lower low).
The profit targets can vary depending on the trader, but they are commonly placed at an upcoming resistance level, a psychological level like $10, or a higher time frame higher high. You could also use a trailing stop instead that secures more and more profit as price continues higher.
Tips for Trading Inverse Head and Shoulders Patterns
Look for Volume on the Breakout
Volume is an important indicator that validates a trend reversal. High volume on the breakout is a sign of strong buying pressure, which confirms the trend reversal. On the other hand, low volume can signal any breakout will be short-lived.
If You Miss Your Entry, Wait for a Retest
If you miss the initial breakout, wait for a retest of the resistance at the breakout price as support. This is a sign that the bulls are still in control of the market and the trend reversal is still valid.
Don’t Be Early
Until the right shoulder forms and a reversal is confirmed, a long position would be fighting a downtrend. Wait for the breakout above the neckline before entering a trade.
Consider the Full Picture
As with everything in trading, one indicator or pattern is rarely enough to make a decision. Consider other factors such as the broader market performance, other key levels of support/resistance, company news and sentiment, and additional technical indicators to use in confluence with the inverse head and shoulders pattern.
Frequently Asked Questions (FAQ)
Q: What is an inverse head and shoulders pattern?
A: An inverse head and shoulders pattern is a trend reversal pattern that signals a potential trend reversal in a downtrend.
Q: What is the difference between an inverse head and shoulders pattern and a regular head and shoulders pattern?
A: The main difference between an inverse head and shoulders pattern and a regular head and shoulders pattern is that the inverse pattern is bullish and occurs in a downtrend, while the regular pattern is bearish and occurs in an uptrend. Otherwise, the two are mirror images of each other.
Q: What negates an inverse head and shoulders pattern?
A: A failed breakout (failure to break above the neckline resistance) negates an inverse head and shoulders pattern.
Q: How do you trade the inverse head and shoulders pattern?
A: To trade the inverse head and shoulders pattern, you should buy the asset on the breakout of the resistance (neckline) or on a retest of the resistance as support. Place your stop-loss below the breakout resistance and the profit target can be an upcoming resistance level.