

A head and shoulders chart pattern typically indicates a reversal at the end of an uptrend. It includes three peaks with troughs between them and can be followed by a significant breakdown.
In this guide, we’ll highlight what traders need to know about head and shoulders chart patterns and how to trade them.
What is a Head and Shoulders Chart Pattern?
A head and shoulders chart pattern forms when there are three peaks and troughs between them. The two peaks on either side are the “shoulders,” while the peak in the center is the “head.” The head peak should be higher than either shoulder peak, but the shoulder peaks do not necessarily need to be at the same price level as each other. A trendline connecting the lows of the troughs between the peaks forms a “neckline.”
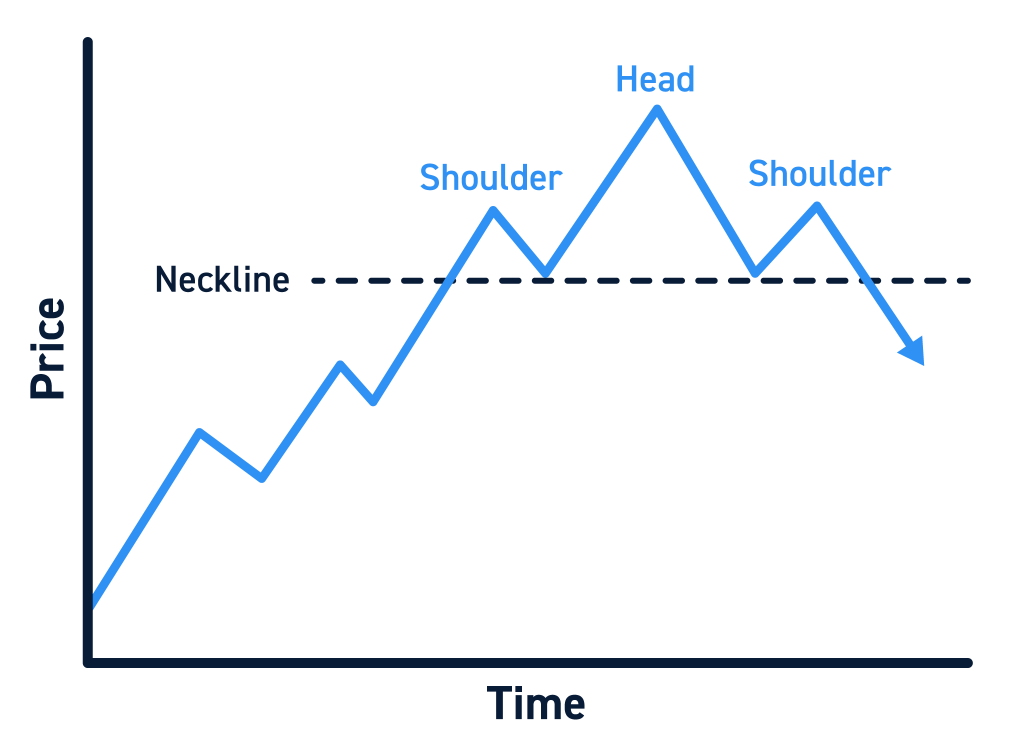
A head and shoulders pattern forms at the end of a prolonged uptrend and usually indicates a reversal. It forms because of a tug-of-war between bullish traders, who buy the dip of each trough, and bearish traders, who sell at each peak. After the right shoulder, bullish sentiment deteriorates and the price breaks below the neckline support.
Components of a Head and Shoulders Chart Pattern
There are several components to a head and shoulders chart pattern:
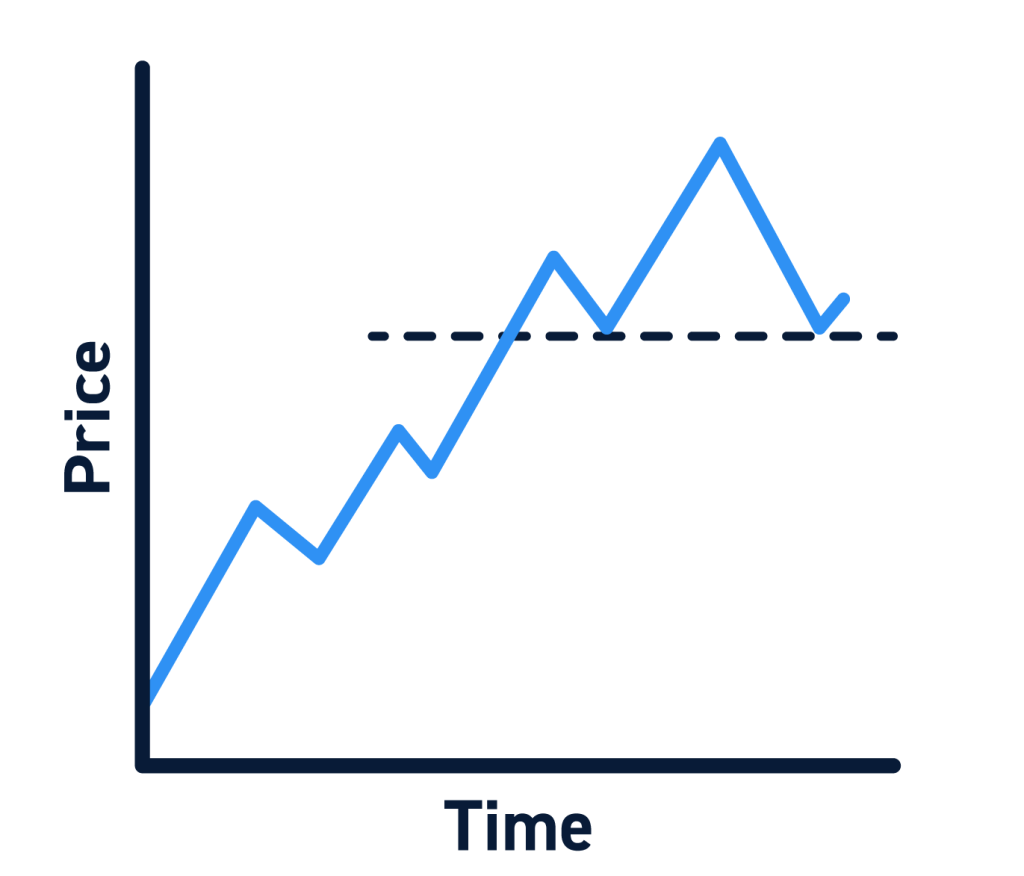
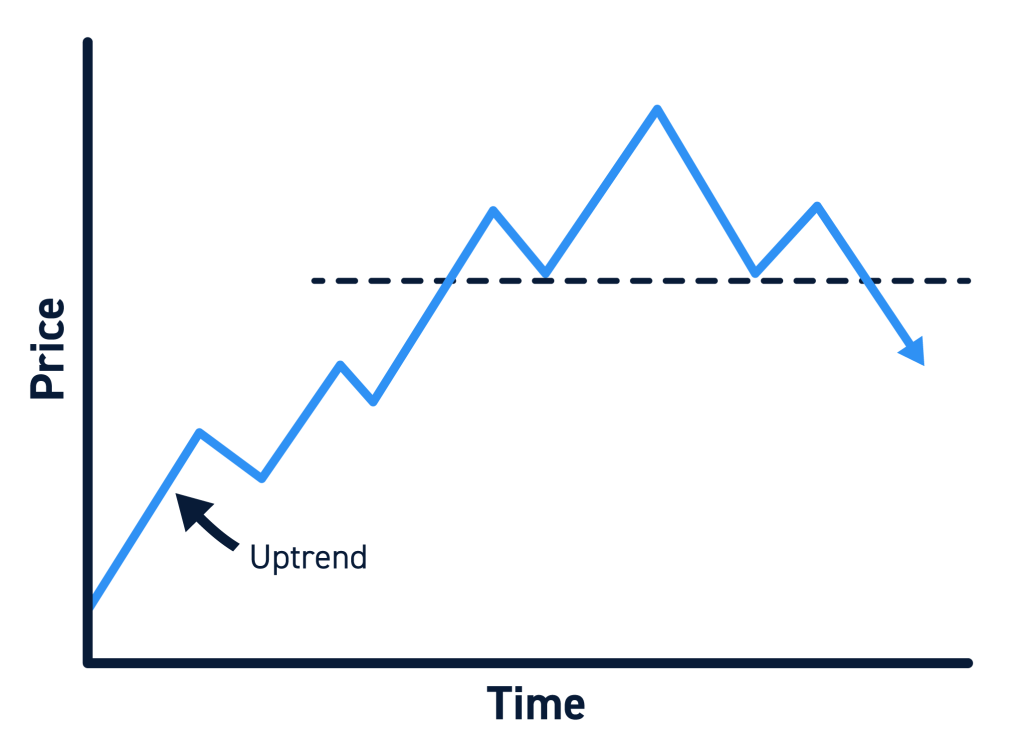
- Uptrend and left shoulder: A head and shoulders pattern must form at the end of a prolonged uptrend. The left shoulder is the peak of this uptrend before a pullback.
- First trough: A pullback after the left shoulder forms the first trough of the head and shoulders pattern. The low of the trough typically remains above the trendline of the prior uptrend, but this is not always the case.
- Head: Following the first pullback, the uptrend continues to form a higher peak – the head of the head and shoulders pattern.
- Second trough: After the head, another pullback forms the second trough of the pattern. This trough may break below the trendline of the overall uptrend (including the bullish price movement that formed the head).
- Right shoulder: Another bullish movement forms the right shoulder. The right shoulder may be symmetrical to the left shoulder in height and width, but this is not always the case.
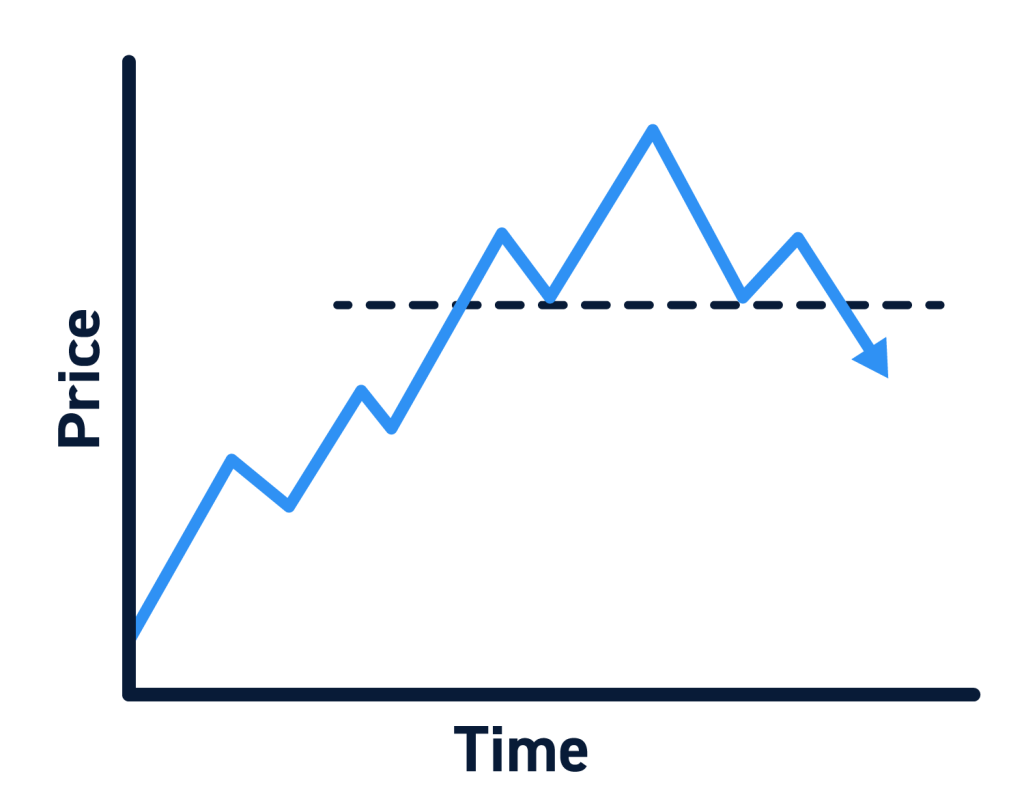
- Neckline: A trendline drawn between the lows of the two troughs forms the neckline of the head and shoulders pattern. The neckline may be horizontal or angled slightly up or down, with a down-angled neckline signaling a stronger impending reversal.
- Breakdown: The decline from the right shoulder should break the neckline, initiating a breakdown. The breakdown below the neckline should be accompanied by above-average trading volume. The magnitude of the expected breakdown is equal to the distance between the head and the neckline directly below the head.
How to Trade a Head and Shoulders Chart Pattern
Traders can take short positions around a breakdown to trade a head and shoulders pattern. Here’s how to trade this pattern:
Step 1: Identify the Pattern Formation
One of the trickiest parts of trading a head and shoulders pattern is identifying the pattern as it forms. The shoulders may not be symmetrical, making it more difficult to spot the pattern.
There are two things to keep in mind when looking for a head and shoulders pattern. First, these patterns require an existing uptrend. Without a strong uptrend, there can be no head and shoulders pattern.
Second, traders should keep an eye on trading volume. In an ideal head and shoulders pattern, volume will be highest as the left shoulder forms, lower as the head forms, and lowest as the right shoulder forms. In addition, volume should increase as the left shoulder declines to the first trough and as the head declines to the second trough.
Step 2: Wait for the Breakdown
The breakdown at the end of a head and shoulders pattern occurs when the neckline is broken. This breakdown should be convincing, occurring on strong volume and coinciding with momentum indicators pointing towards strong bearish momentum.
Step 3: Enter a Trade
Once a breakdown is confirmed, traders can enter a trade. Since a head and shoulders pattern predicts a bearish move, most traders will short the target stock to profit from the breakdown.
The expected size of the breakdown can be estimated by measuring the distance from the top of the head to the neckline directly below the head. Subtract this distance from the neckline at the breakdown point to calculate a profit target.
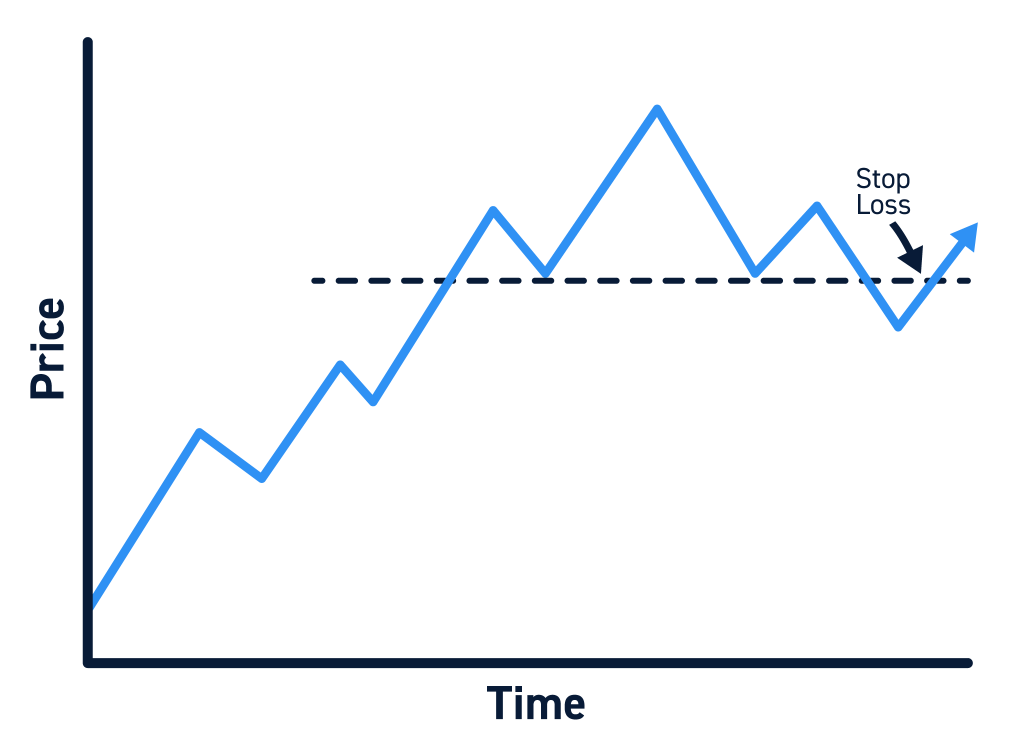
Traders should consider setting a stop loss slightly above the neckline. Keep in mind that the neckline can serve as support for the falling price, so the price may bounce off the neckline or retest the neckline after the breakdown initiates.
Tips for Trading Head and Shoulders Chart Pattern
There are a few things traders should keep in mind when trading a head and shoulders pattern.
Requires an Uptrend
Head and shoulders patterns only form after a strong uptrend. Sideways trading action can resemble a head and shoulders pattern in the absence of a prior uptrend, but they will not signal a bearish reversal in that case.
The Pattern can be Messy
Head and shoulders patterns aren’t always obvious, in part because the shoulders, head, and troughs can be tilted or asymmetrical. In these cases, remember that a downward-sloping neckline indicates a more likely reversal than an upward-sloping neckline. Also keep an eye on volume and momentum indicators, which can provide additional evidence that a bearish reversal is on the way.
The Breakdown Should be Convincing
The neckline of a head and shoulders pattern can serve as support, so a breakdown below this trendline should be convincing. The breakdown should occur on higher than average volume and coincide with momentum indicators pointing towards increasingly bearish momentum.
Always use a Stop Loss
It is possible that the breakdown following a head and shoulders patterns fails and that a stock’s price rises back above the neckline. Traders should always have a stop loss in place to protect themselves if this happens. Place a stop slightly above the neckline, leaving enough room for the price to retest the neckline as resistance after the breakdown.
FAQ
Is a head and shoulders pattern bullish or bearish?
A head and shoulders pattern is a bearish pattern that signals a reversal after a prolonged uptrend.
Why do head and shoulders chart patterns form?
Head and shoulders patterns form as bullish momentum wanes following an uptrend and a tug-of-war develops between buyers and sellers. Sellers step in at each peak, while buyers step in at each trough. However, bearish strength is growing overall, leading to a decline in trading volume during bullish movements and a strong breakdown at the end of the head and shoulders pattern.
Where should I set my profit target on a head and shoulders breakdown?
The expected magnitude of the breakdown after a head and shoulders pattern can be found by measuring the distance between the neckline and head. Subtract this distance from the neckline at the breakdown point to calculate a potential price target.
Where should I set my stop loss on a head and shoulders breakdown?
Traders should always use a stop loss when trading a head and shoulders pattern because there is a chance that the breakdown fails. Consider placing a stop loss just above the neckline at the breakdown point, leaving enough room for the neckline to be retested as a resistance line after the breakdown.
What is an inverse head and shoulders chart pattern?
An inverse head and shoulders pattern is the opposite of a head and shoulders pattern. It forms at the end of a prolonged downtrend and can signal a bullish reversal.


