

Speculating on the direction and duration of stock price movements is the essence of trading. Charts help to visualize and interpret price action. They are further enhanced with the use of tools referred to as technical indicators or studies. Seasoned traders often construct trading methodologies and strategies utilizing the combination of technical indicators that work best for them.
What is a Technical Indicator?
Technical indicators are tools that can be added to a stock chart to help interpret and analyze the price action. Depending on your trading platform these may also be referred to as “studies”. These tools take trading data to generate visual indicators that measure and illustrate conditions that the underlying stock is experiencing as well as potential price inflection points.
Technical indicators use the common data components of price, volume and time to calculate and illustrate data-driven measurements and conditions like trends, patterns, momentum and support/resistance levels.
What is the Point of Using Technical Indicators?
Technical indicators act like gauges that enhance your ability to interpret and analyze price action. They visualize patterns and help quantify signals and triggers that can be used to execute trades. Here’s four key reasons to use technical indicators:
Forecast Future Price Trajectories
Technical indicators help to plot trends and monitor momentum. By utilizing these indicators on multiple time frames, they can enable you to forecast potential price action when high probability patterns develop. This is not predicting but preparing you to react in anticipation of price action. For example, your indicators project a high probability breakout on $XYZ stock to $26.75, you can prepare to scale out of your position from $26.65 and higher up to the resistance target.
Simplify Decision Making
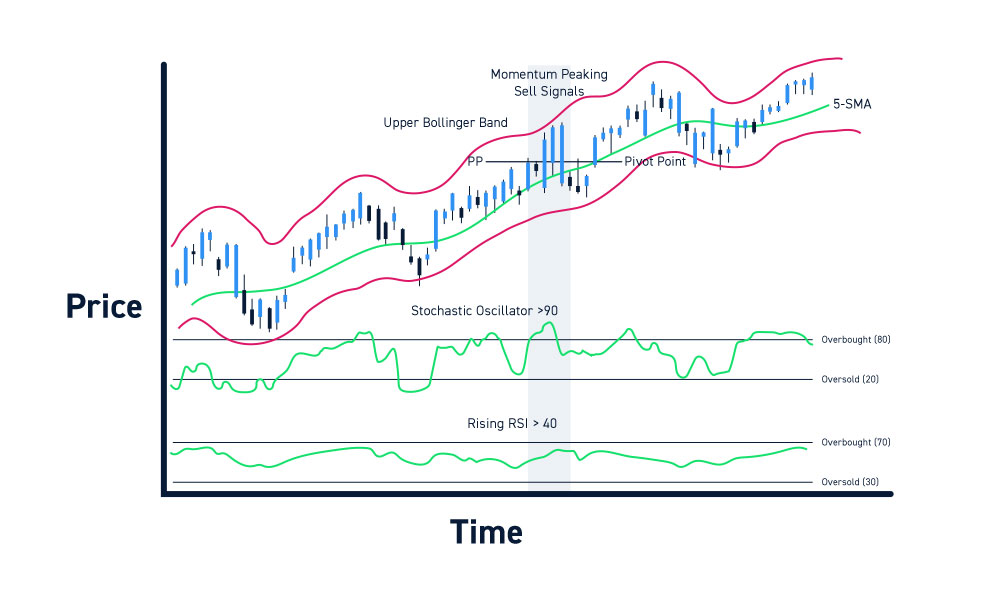
Trading platforms with technical indicators enable you to make trading decisions at a “glance” thanks to the visual nature of charts. If you are long a position, a simple glance at your charts indicating momentum peaking (Stochastic oscillator >90) near a double resistance area (Pivot point and Upper Bollinger Band) is a no brainer to sell your shares. You may want to keep riding an uptrend higher since shares are trading above its 5-period simple moving average with a rising RSI > 40. Thanks to momentum and price indicators, decisions can be made in a quick and timely manner.
Identify Significant Price Areas
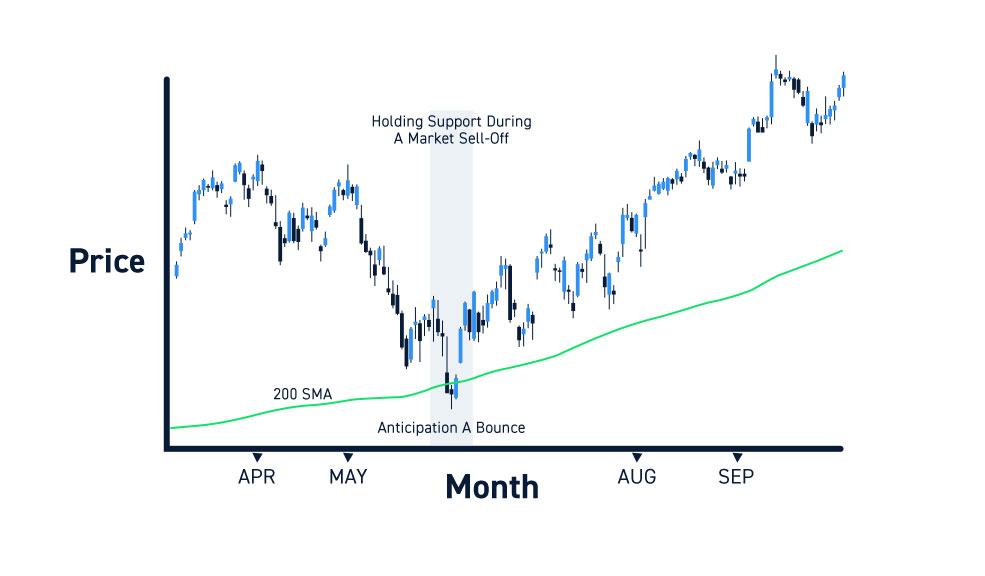
Technical indicators generally apply to price or momentum. Price indicators help you discover and monitor significant price areas for support and resistance. For example, moving averages are a great technical indicators that dynamically update support and resistance levels. Widely followed technical indicators can actually produce a self-fulfilling prophecy effect like the 200-day simple moving average (SMA). When everyone expects the 200-period simple moving average to hold a support on a market sell-off, it often will do just that. In many cases, traders will step in ahead of the 200-day SMA in anticipation of a bounce.
Find Price Inflection Points
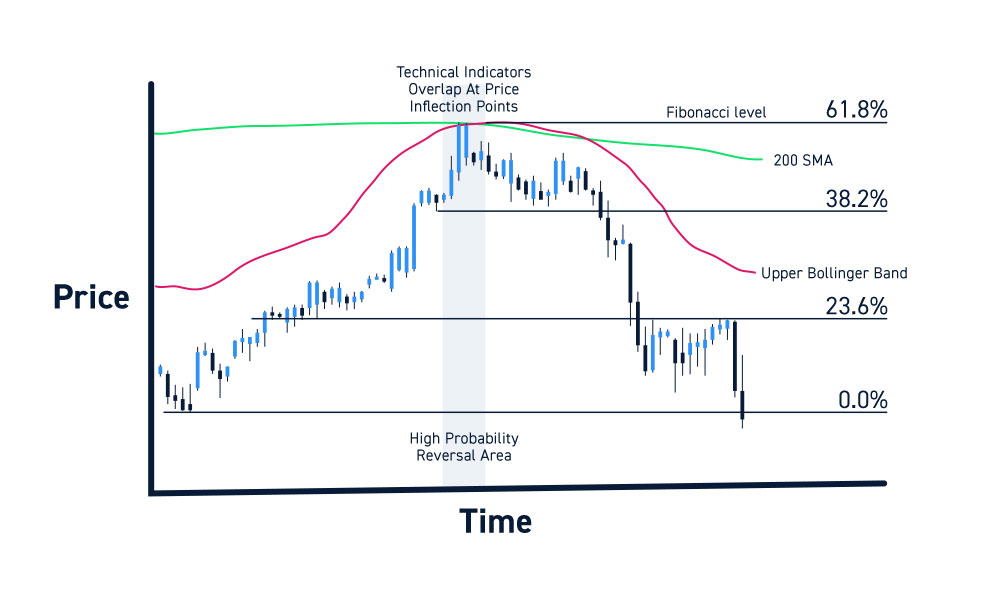
Certain prices have a high probability of triggering a break or deflection like a pinball bumper. These price inflection points can be invisible without the help of price indicators. Inflection points can be significant price levels that result in a breakout/breakdown, deflection or a reversal in the price action. The probability of a reversal rises when more technical indicators overlap at these price inflection points. For example, a 200-period SMA resistance that overlaps with a 1.618 Fibonacci level and Upper Bollinger Band are individually strong resistance levels but linked together make for a high probability reversal area.
Do Technical Indicators Actually Work?
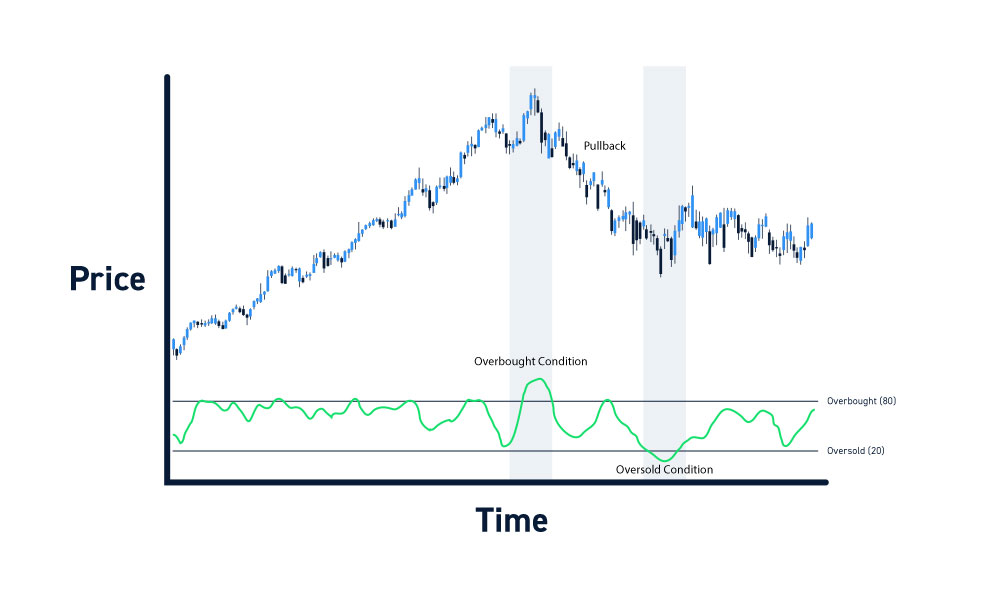
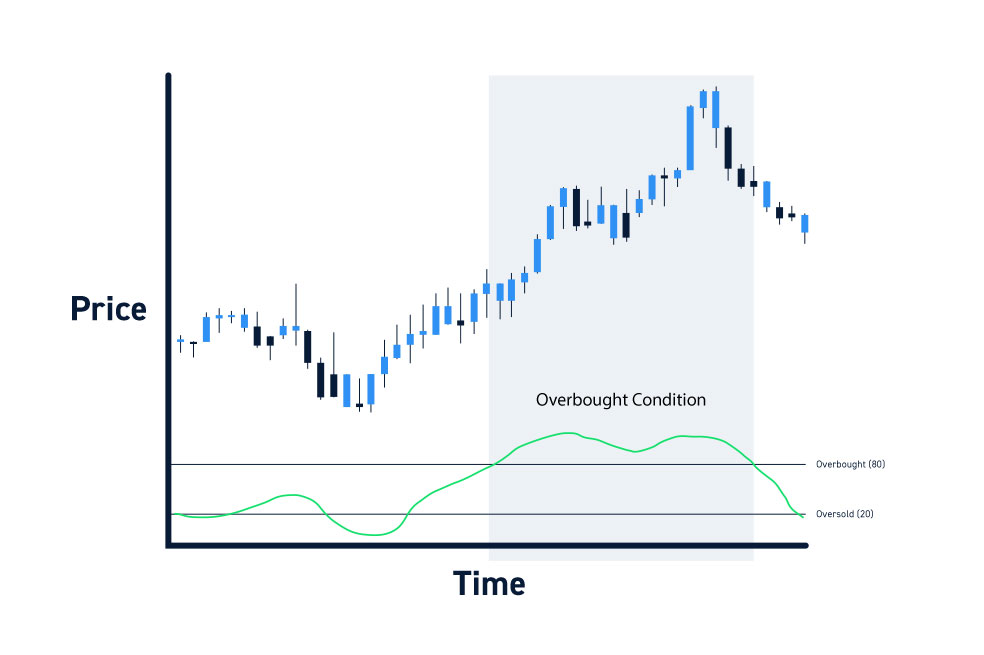
Potentially, yes, but they are not the holy grail. It is important to understand the function of each technical indicator and the limitations as well. A technical indicator can work for a period of time while a condition is active. For example, a stock trading above the stochastic 80-band indicates an overbought condition that becomes apparent when the shares pullback as the stochastic oscillators fall back under the 80-band. As the price falls more, the overbought condition dissolves and may actually turn into an oversold condition if stochastic falls under the 20-band.
Understand Both Nominal and Anomaly Indicator Conditions
Traders must understand what information they are seeking with each indicator and keep that in mind as more indicators are used to generate a cumulative effect. A stock can reach and overbought level above the 80-band and remain there for much longer than normal as it generates a short-squeeze. Does this mean the stochastic indicator didn’t work? No. It’s just an indicator. How you use the indicator is the key. For example, if you were anticipating a short squeeze, the overbought stochastic works in your favor as an ascending triangle breakout triggers the next leg up. Understand both sides of an indicator, the nominal action and the anomalies that can form and be ready for both outcomes.
How to Use Technical Indicators Properly
Use each indicator purposefully by understanding the function of the indicator and how effectively it performs under different market conditions. Does the indicator help in your decision-making? If the answer is no, then move on with another indicator. Remember, price and momentum are the two general types of technical indicators.
Understand What You are Using and Why it Works or Not
You should understand the function of each indicator you use. Is it for price or momentum analysis? Each indicator should be tested by itself and then in conjunction with the other indicators you are using. The goal is to generate a synergistic effect that streamlines your analysis and results in helping your decision making with your trades. Don’t take the textbook explanation of what the function of an indicator is. Learn it firsthand. If an RSI above 70 is considered overbought, then find out firsthand if stocks fall immediately or continue to rise higher and stay elevated. What conditions caused prices to collapse and what caused prices to grind higher? Become a student and approach it in a purely clinical manner. As you get familiar with an indicator, add it to your other indicators and study the synergistic effects.
Find the Need and Fulfill It
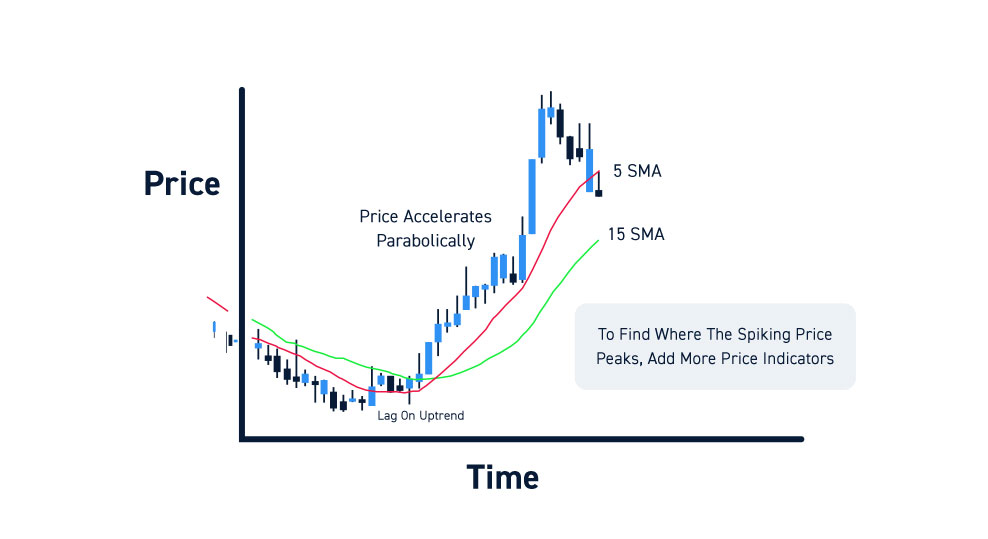
For example, a two-combination simple moving average like a 5-period and 15-period is a strong trend indicator that provides two levels of price support. Since they are an average of trade prices segmented by the periods (5 and 15), they will usually lag behind the current price on active uptrends and downtrend. When a stock price accelerates parabolically, it can leave the 5-period moving average way below (e.g. $XYZ shares breakout 2 points higher to $27 while the 5-period moving average sits at $25.25). The question is how can you anticipate where the spiking price may peak out at? This question can be answered by adding more price indicators like pivot points, Bollinger Bands or Fibonacci Extensions. As a “need” arises, find the indicators to fulfill that need. As they say, necessity is the mother of invention.
Avoid Indicator Overload
It’s easy to start adding a ton of indicators on your charts to address every possible “need” and outcome. Unfortunately, indicator overload can result in conflicting signals not to mention becoming an eye sore with too many lines on your charts. The goal is efficiency. To use the most effective indicators and keep them to a minimum count. Be frugal and selective by testing them through every type of market condition (rising, falling and flat). It helps to have different layouts on your charting platform that contain different indicators to test simultaneously with your core indicators.
Combine with Other Analyses
As you add more complementing indicators, you should continue to see how they work together. Does the momentum indicator correlate with the price indicators? When do they diverge and why? When you understand that indicator divergences also trigger signals, that’s when you will realize that indicators work on “both” sides, nominal (expected) and anomaly (unexpected) conditions. This is what separates the “tourists” from the real students of the markets.
Seasoned traders can recognize the nuances and the anomaly situations and either sidestep them or indulge in them as they can provide large opportunities by trapping participants on the wrong side. Beginners should always start with nominal conditions, but eventually become conditioned to anticipate and react to anomaly situations. Adding additional analysis that includes volume studies, complex harmonic patterns and Fibonacci ratios can help refine price interpretation.
Look For Patterns at the Ticker-Level
Stocks are like animals in the wild. They have their own price “behaviors” and react to different indicators and patterns more or less effectively than other groups of stocks. Stock tends to move with peers in similar industries and sectors. By monitoring patterns on a ticker level, the price action can be parlayed to other stocks within the group. (i.e. casino stocks tend to behave similarly and move together). If a bank stock bounces off its 50-day moving average, chances are likely its peer stocks are doing the same.
Two Types of Indicators Applications
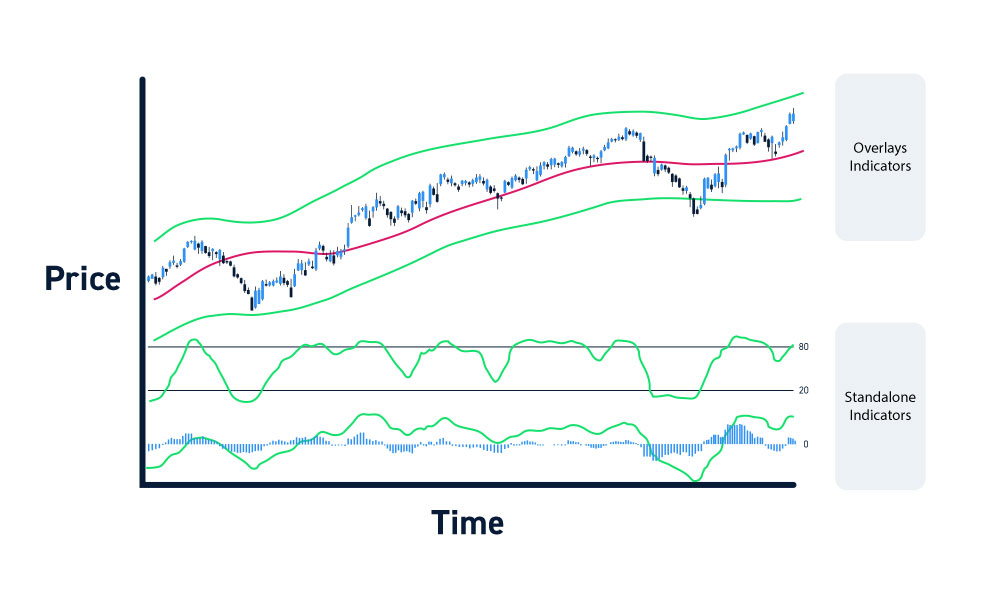
When adding indicators to your charts, there are two types of applications: overlays and standalone. Overlay indicators are placed directly onto a price chart and react directly to the price moves. For example, a 5-period simple moving average is a basic trending indicator that tend to deflect price pullbacks when sustaining a trend. This can visually be observed when candlesticks touch and then bounce of the 5-period SMA on an uptrend.
Standalone indicators are used by themselves with no relation to price. Momentum indicators like an RSI, MACD or Stochastic are placed on their own chart separately from the price chart to measure the overbought and oversold conditions of price moves. Overlay indicators tend to apply to price and standalone indicators tend to apply to momentum. They are usually placed one (price) on top of the other (momentum) to provide an immediate analysis of price action.
Technical Indicators You Should Be Aware Of
These indicators are commonly found on most trading platforms and charting packages. They serve the purpose of smoothing price action, gauging momentum and finding price inflection points. Using them synergistically is key to creating trading methodologies and strategies.
Indicators for Smoothing Price Action are used on a price chart. This includes:
Moving averages (MA) continuously calculates and plots the average price the trades executed during specific time period increments. For example, a 15-minute 20 period moving average plots the average price of 20 x 15-minute periods on a continuous basis with a single line. Multiple moving averages can be used to visualize the trend, breakouts and breakdowns.
Volume Weighted Average Price (VWAP) is a commonly used indicator that applies volume into the calculation of average price and draws a line similar to a moving average. Trades with larger volume carry more weight in the calculations. The VWAP is often used by institutions to measure how well their large orders were filled.
Bollinger Bands (BBs) are a combination of 3 moving averages that provide an upper envelope, base line and lower envelope. The upper and lower Bollinger Bands provide a “nominal” price range where share prices are expected to peak or bottom before pulling back to the base line BB. Bollinger Bands also compress and expand like an EKG, illustrating periods of price compression (consolidation) versus expansion (breakouts/breakdowns).
Indicators for Gauging Momentum are standalone indicators that provide an overbought or oversold gauge that are used in conjunction with price indicators. Most of these indicators are placed on a graph from zero-to-100 and trigger overbought and oversold levels at specific levels. Buy and sell signals are generated when these levels are triggered. Some of the most commonly used ones are:
Relative Strength Indicator (RSI) is placed on a graph from zero-to-100. When the oscillator drops under 30, it’s considered oversold and when it rises through 70, it’s considered overbought. Traders commonly use the bounce through 30 as a buy signals and fall under 70 as a sell or short sell signal.
Stochastic Oscillator is composed of two oscillators, a lead %K and laggard %D. When these oscillators crossover each other above the 80-band, it signals overbought conditions. When they fall under the 20-band, it signals oversold conditions.
Moving Average Convergence Divergence (MACD) is composed of two moving averages that oscillate above and below the zero-band. Users can also view this indicator as a histogram or in conjunction with a histogram. This momentum indicator shows bullish conditions above the zero band and bearish conditions when the moving averages/histogram fall below the zero band. Buy and sell signals can be triggered on the zero band crossovers in addition to the reversals off the extreme bands on the scale.
Indicators for Finding Support/Resistance are usually overlaid on top of the price chart and can have dynamic or static price levels. Some of the most commonly used are:
VWAP + Moving Average is a commonly used indicator set that combines two types of moving averages to derive trend (direction of the MAs), support and resistance visually with lines representing each indicator.
Fibonacci Retracements are derived from Fibonacci (fib) series-based ratio calculations between a low and high plot point. The 0.618 fib tends to carry the most weight if the high/low plots are accurate and provide a strong price inflection point of deflection or break.
Parabolic Stop and Reverse (SAR) places dots on the price chart signaling support and direction when viewed consecutively. The dots also provide a stop-loss level for a stock that can be used in conjunction with other indicators. When the dots start to change direction, it indicates the reversal of a trend. Stops are triggered before reversals are formed.
Should You Use Technical Indicators?
Depending on your style of trading and temperance, indicators may or may not be for you. The best practice is to kick the tires and test them out in accordance with your existing methods to see if they enhance your decision making. If so, then be selective of which indicators to add to your charts and be sure to test them out individually first. Don’t be in a rush to add a bunch of indicators as they can lead to indicator overload. The goal is efficiency and refinement of your trading methodology that ultimately improves your decision making and trading performance.


