Often times an obscure stock will hit the ticker tape and scanners showing a 100% or more price change (IE: XYZ stock trading at $12.20 from $6, up + $6.20). This naturally draws eyes and attention from traders. How awesome would be if you were long the stock from $6? How much pain would you be in if you were short the stock from $6? It is likely that this stock is experiencing a short-squeeze which is a thrill ride for longs and a nightmare for short-sellers.
What Is A Short Squeeze?
Bulls take long positions seeking to profit from buying low and selling higher. Bears take short positions seeking to profit from short selling high and buying/covering lower. If share prices rise instead of falling, short sellers start to lose money. As share prices rise higher, more short sellers get compelled to cover their positions to minimize losses. This in turn causes more buying from other shorts and buyers coming in off the fence, which accelerates share prices higher.
Being caught on the wrong side of a short squeeze is one of the worst experiences a trader can go through. It’s akin to being viciously dragged into the ocean by a riptide while strolling on the beach.
What Happens During A Short Squeeze?
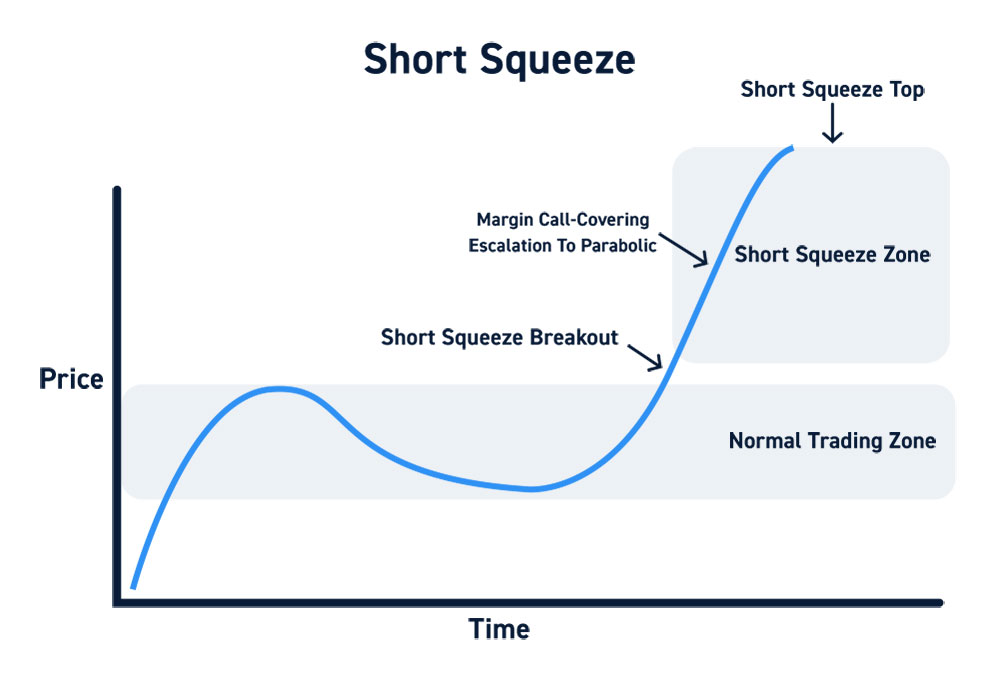
A short squeeze forms when a stock accelerates in price so fast that the short sellers are forced to cover their positions by buying shares in the open market. The buying triggers more buying as share prices often go parabolic.
While short sellers would normally average in their position prices by adding more shares to their position, the problem arises when the availability of borrowable shares evaporates. When there are no available shares to borrow, it forms a vacuum that triggers possible escalation of maintenance margin requirements from their brokers. The increase of maintenance margin means more funds must be transferred immediately or the short position must be trimmed down, by buying shares to cover. Failing to meet the maintenance margins can also trigger forced liquidation where the brokerage automatically buys shares at market.
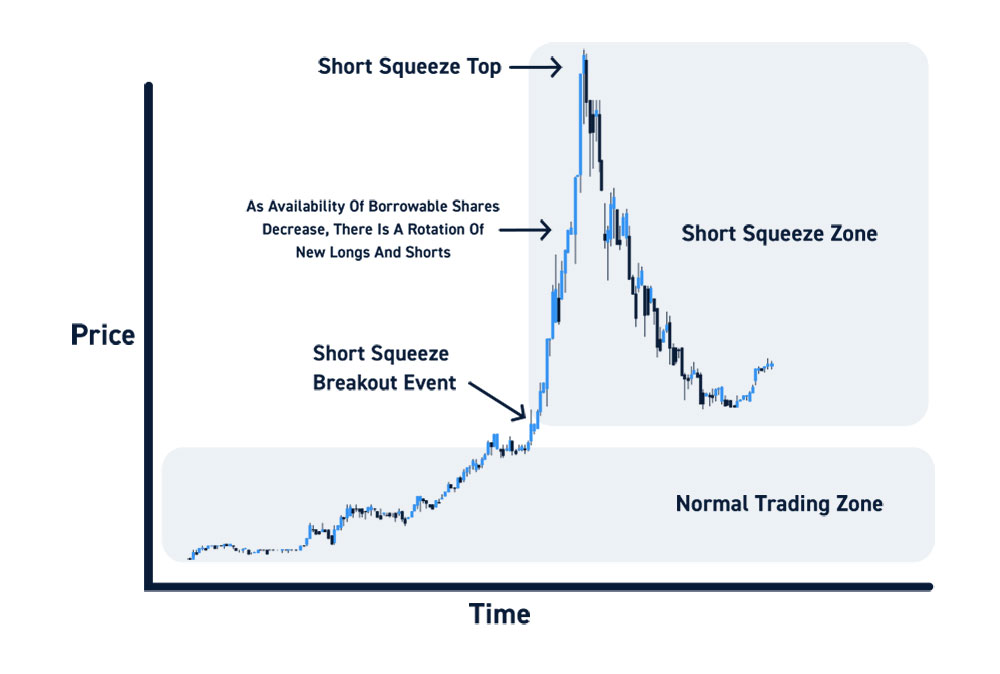
The rotation of participants is a cycle of new buyers coming in while old shorts stop out and new shorts coming in as old buyers take profits results in a perpetual rise in prices.
Short Squeeze Versus A Breakout
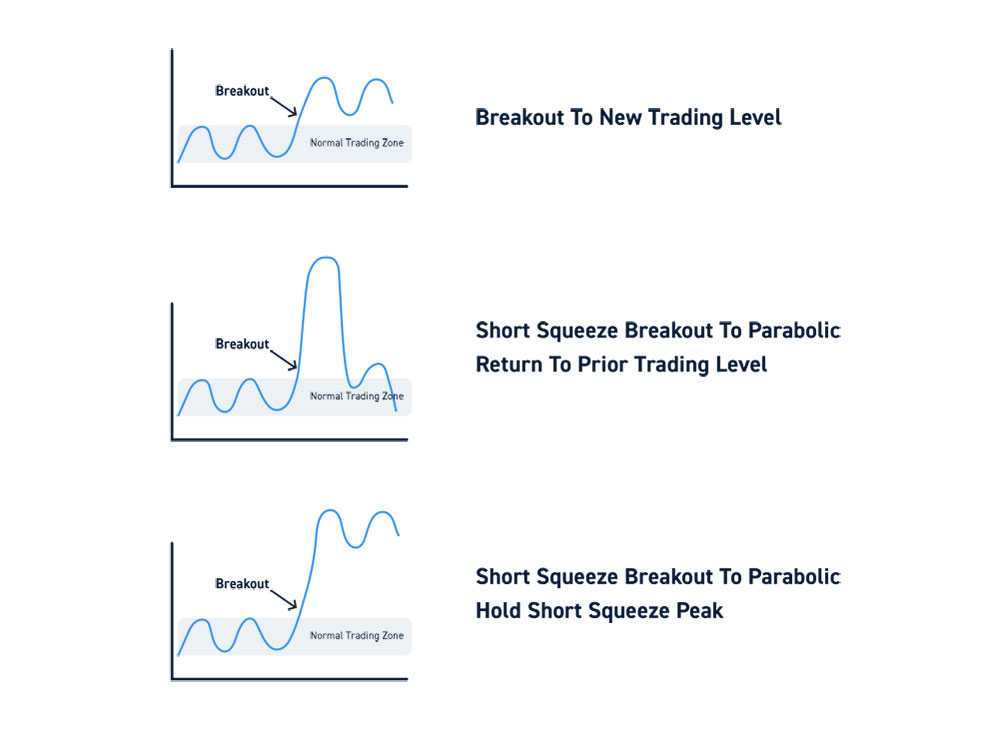
While many breakouts start with a short squeeze, there are instances where virtually the whole upside breakout can be attributed to a short squeeze. This can happen in the absence of material news or catalyst events or in advance of an anticipated event. This is also common in stocks with a large short interest or percentage of the float held short. Some stocks can start off with the short squeeze that continues to hold elevated price levels long enough for real buyers to come in off the fence. Stocks that hold their short squeeze peaks make headlines which draws in more interest from potential investors.
How To Find Short Squeeze Candidates In Advance
The underlying structure of a stock is important to the susceptibility of triggering a short squeeze. While short squeezes can’t be predicted with 100% accuracy, there are factors that can contribute to the proverbial spark lit in a kerosene-soaked warehouse. These signs include:
High short interest in a stock may lead to a short squeeze. Short interest is considered “high” when it rises above the 20% mark. The higher it rises, the more susceptible it becomes for a squeeze. For example, a stock with a 57% short interest is more likely to squeeze than a stock with a 22% short interest.
Low float stocks are very susceptible to short squeezes due to the lack of liquidity which causes prices to spike with little volume and the inability to easily locate short inventory. These stocks tend to fall into the hard-to-borrow (HTB) category of stocks which are costly and limited in short inventory. As share prices accelerate, they become even harder to borrow.
Increased volume and volatility is the proverbial match get lights the kerosene. Heavy volume accompanied by large price spikes generates interest as the stock hits price tickers and radar screens. This invites more participants to the table as they pile into the shares both long and short.
Trapped majority is the ammunition in the kerosene-soaked warehouse that explodes. Short squeezes typically result with the majority being trapped on the wrong side of the trade and desperately trying to get out. This applies on both the long and short side of the trade. As a short squeeze peaks out, there will also be longs that get trapped at the peaks desperately trying to average their size and stopping or blowing out of their positions.
Considerations When Trading Short Squeezes
There are two sides of a short squeeze and careful considerations must be taken on each.
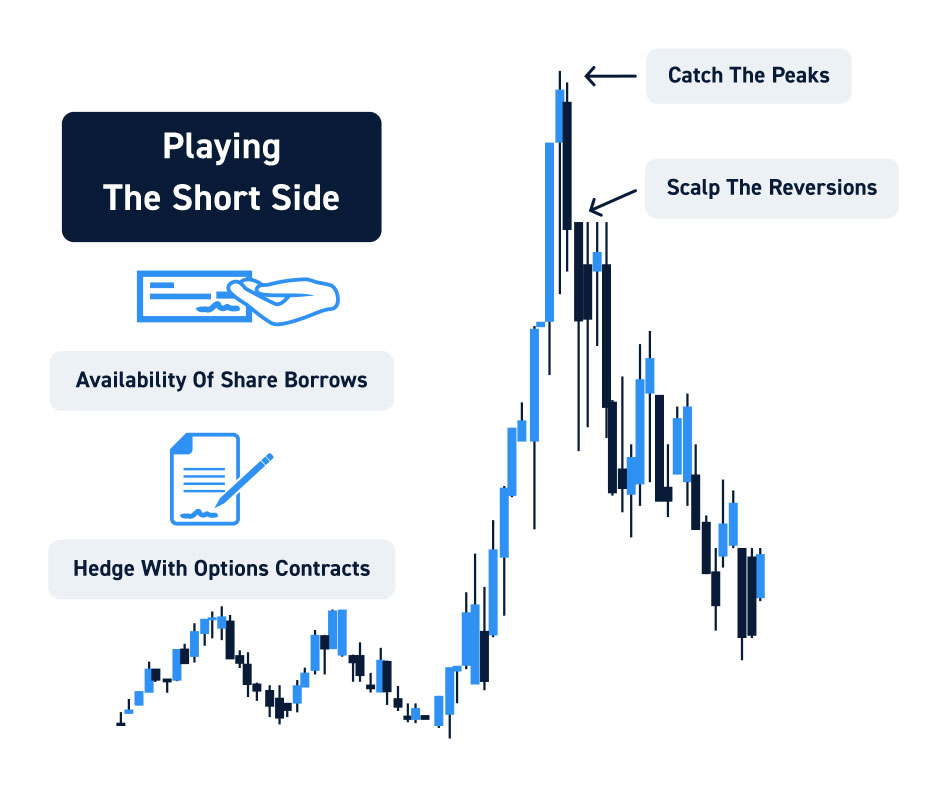
On the short side, the goal is to try to catch the peaks and scalp the reversions and continue to sprawl against the spikes. Always pay attention to the availability of share borrows. If you notice the inventory shrinking quickly, be proactive and trim down positions before the borrows run out. It’s also possible to hedge with options contracts (unless they are small caps without options available).
Therefore, always check the short inventory and availability of options. Be patient in your scaling and control your risk by allocating sizing properly within your comfort zone. Always play out worst case scenarios and implement stop-losses ahead of time. Be aware of stocks that are on the HTB list and never play with more than a small percentage of total account on any single position.
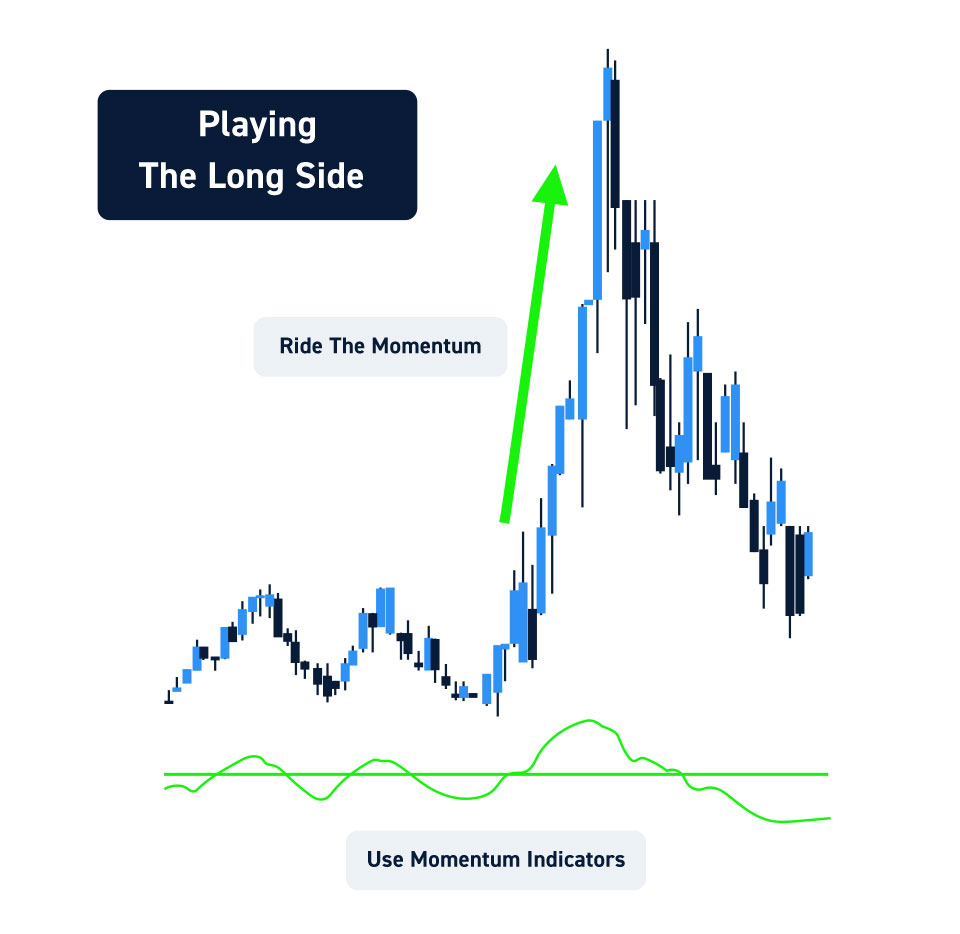
On the long side, the goal is to ride the momentum as long as possible but not to overstay until momentum and trend reverse. It’s prudent to have momentum indicators embedded into your trading strategy to forewarn when price momentum is peaking out and reversing. Short squeezes tend to peak out viciously as well once enough longs are trapped. Consider these temporary trades on either side.
You should understand why the stock is moving. If you confuse a short squeeze for a genuine breakout, you are at a disadvantage. Short squeezes and genuine breakouts will unfold differently in the long run.