Thorough research and analysis for any stock involves both fundamental and technical analysis. Fundamentals analysis involves studying the business operations including financial reports, press releases, industry trends and performance metrics. Technical analysis involves reviewing the price action of the underlying stock including pattern set-ups, triggers, trends, support and resistance levels. However, many investors and traders alike overlook a key structural component of publicly traded stocks that has a material and influential impact on price action and fundamental valuations.
Understanding A Stock’s Share Structure
All U.S. publicly listed companies have a basic stock share structure as regulated by the Security and Exchange Commission (SEC). When companies issue stock, they are either free trading or restricted securities.
Free trading shares are common stock valued by the price they are last traded at on the exchanges. They can be bought and sold on the public exchanges at the national best bid offer (NBBO) price during and after market hours through a licensed broker-dealer platform.
Restricted shares are prohibited from being traded or transferred, until restrictions are lifted by meeting certain eligibility requirements. Restricted stock is illiquid since they can’t be traded, cashed out or transferred until converted into free trading shares and registered with the Depository Trust & Clearing Corporation (DTCC).
Share Classifications
It’s important to understand the distinctions between the three types of share classifications: authorized shares, outstanding shares and the stock float.
Authorized shares are the maximum number of shares that the company can issue as documented in the articles of incorporation.
Outstanding shares are the total number of shares that have been issued including free trading and restricted stock. The number of outstanding shares is very important when determining valuation (i.e. market capitalization) and performance metrics (i.e. earnings per share). The value of a company, market capitalization, is measured by multiplying the stock price by the total outstanding shares. When companies release earnings reports, they report using earnings-per-share (EPS) metric, which is also based on the outstanding shares with some modifications (i.e. diluted earnings per share, adjust earnings per share).
What Is A Stock’s Float?
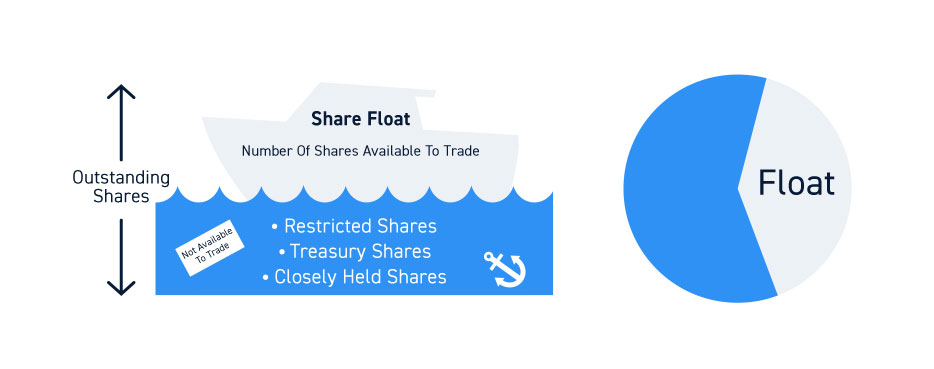
The share float, also referred to as floating shares or stock’s float, is the actual number of shares that are available to trade. This is calculated by subtracting the restricted shares, treasury shares and closely held shares by insiders and beneficial owners from the outstanding share count.
Why A Stock’s Float Matters
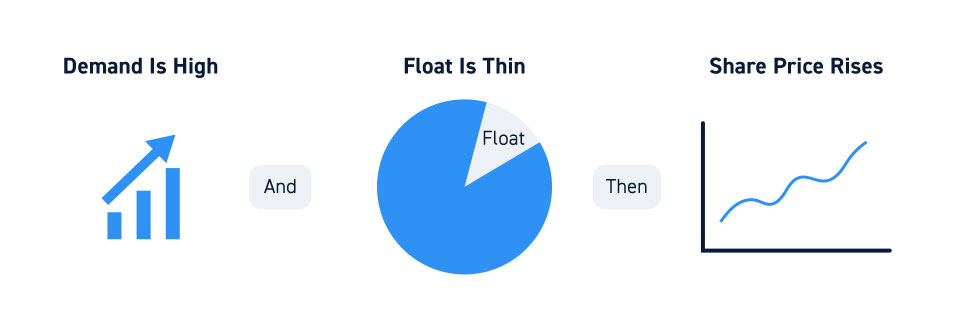
A stock’s float has a material and noticeable impact on share price action. The float represents the true supply of shares available for trading. If demand is high but supply is low, then share prices rise as buyers bid up prices as sellers raise their offers. Thin float stock prices can move dramatically on small volume activity.
The determination of a “low float” is relative to the price of the stock. Depending on the share price, thin floats can be stocks with less than 20 million shares. However, even a 100 million share float can be considered “low” depending on the stock price. As a rule of thumb, the higher the price of a stock, the thinner the liquidity becomes.
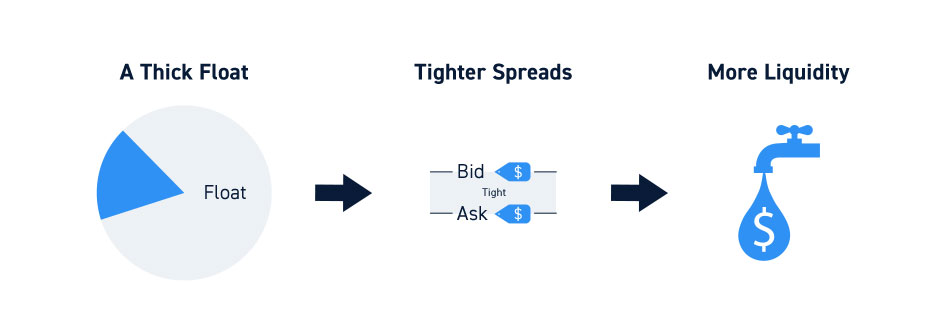
A thick float has much more liquidity resulting in tighter spreads and less slippage. It takes much more volume to move prices on thick float stocks. Beginners should start with thick float stocks before attempting to trade thin floats.
Characteristics Of Low Float Stocks
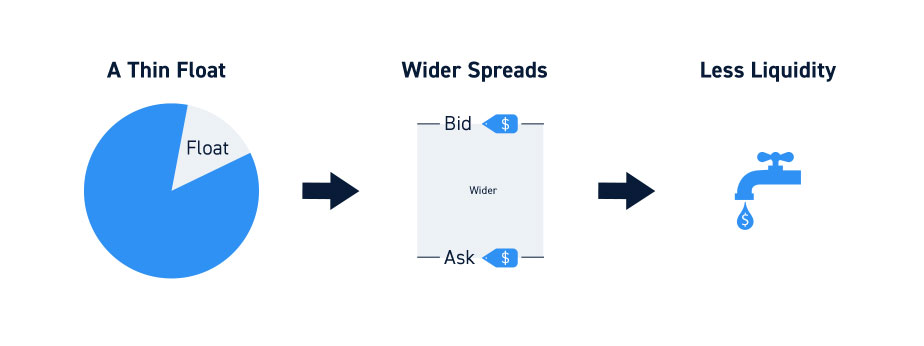
A low float, also referred to as a thin float, tends to have less liquidity which results in wider bid and ask spreads. Due to the smaller supply of stock, any surge in demand can trigger rapid price moves. This is why low float stocks tend to have higher volatility.
For beginners, this can result in a lot of slippage buying and selling shares. As a rule of thumb, don’t use market orders on low float stocks. Instead, use limit orders to cap the slippage. Experienced traders using a direct market access (DMA) broker should consider direct access routing accompanied by hidden and/or reserve orders to split the spreads for fills and potentially earn liquidity rebates.
The Impact Of Float On Short Sellers
It can be more difficult to find shares to short in low float stocks, and these stocks are often found on hard-to-borrow lists. HTB stocks usually require a short locate request, which can incur a fee. They tend to have a higher borrowing rates and require higher maintenance margins.
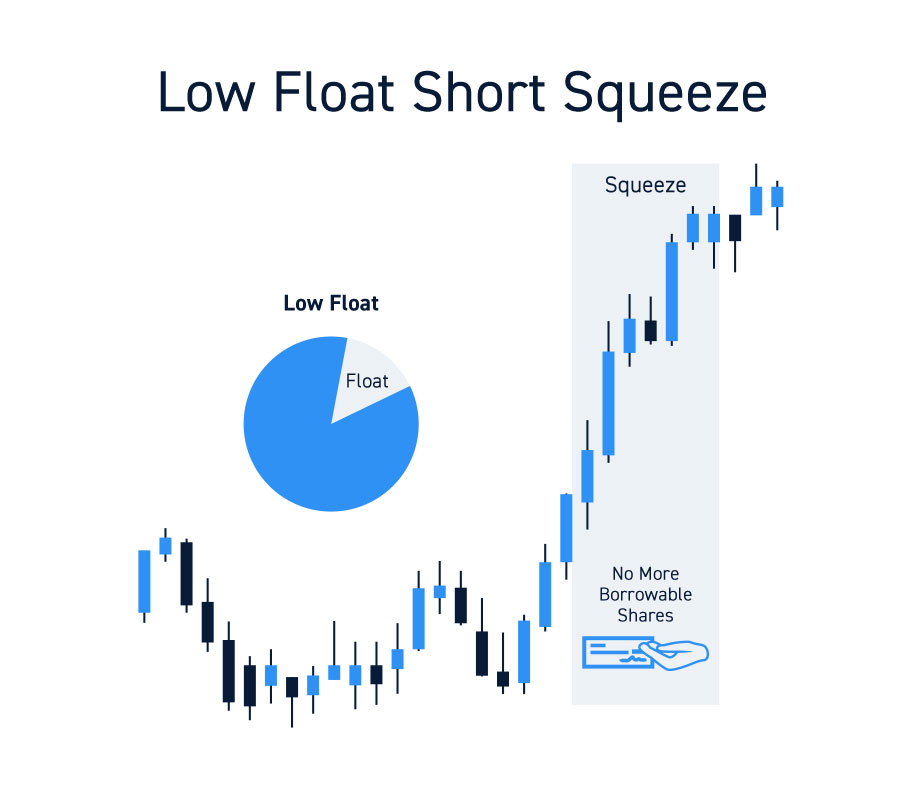
While price swings can be extreme and profitable if on the right side of the move, low float stocks are highly susceptibility to short squeezes. Short sellers often get “trapped” when there are no more borrowable shares with the only option being to cover the shorts before intraday margin calls get activated triggering forced liquidation (brokerage platform automatically covers the shorts by buying shares with market orders). Short covering requires buying back shares in the open market, which raises demand and drives prices higher forcing frantic short sellers to chase shares even higher. A total loss of the capital in your account is quite possible if you are concentrated on the short side in a stock that is experiencing a short squeeze.