

Learning to manage risk effectively is key to success as a trader. Good risk management helps minimize your losses and preserves the gains from your winning trades. By understanding the risk/reward ratio of any individual trade, you can better decide which setups to pursue and maximize your net profits.
In this guide, we’ll explain the concept of risk/reward in trading and how you can use it to manage your trading risk.
The Importance of Managing Risk as a Trader
Trading is about more than just winning trades. It’s also about managing risk and minimizing losses. The better you are at keeping losses small, the more you can boost your net profits from your winning trades.
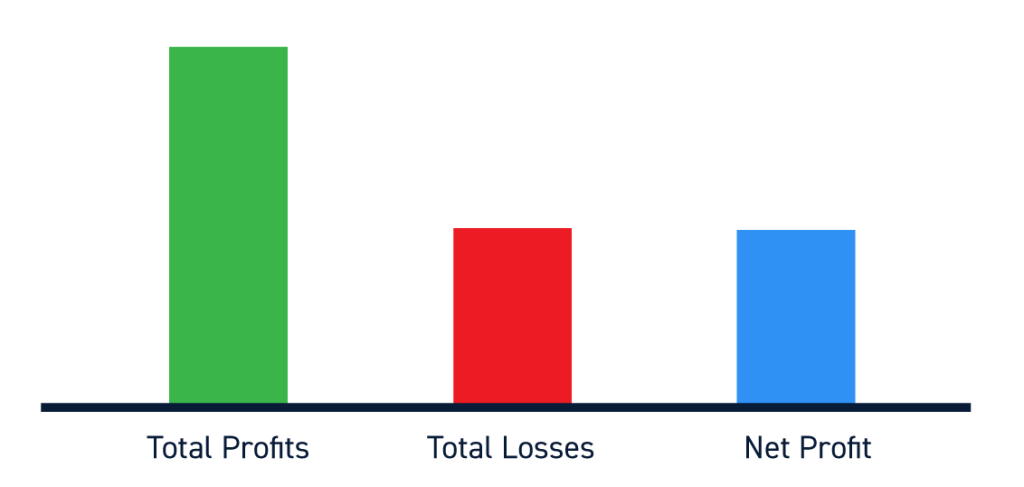
The importance of managing risk is underscored by the fact that a trader who wins just half of their trades can be profitable. The key is to keep your average loss smaller than your average profit.
What is Risk/Reward?
The risk/reward ratio is a measure of how much you stand to profit for every dollar you risk on a trade. It provides a measurement of the potential risk and reward for every trade, allowing you to objectively compare potential trades and refine your overall trading strategy.
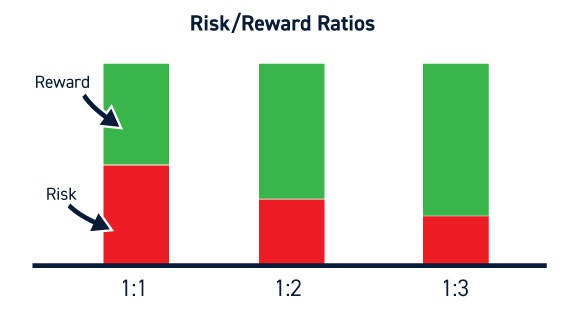
Using risk/reward ratios effectively requires you to know what a good risk/reward ratio is. A 1:1 ratio means that you’re risking as much money if you’re wrong about a trade as you stand to gain if you’re right. This is the same risk/reward ratio that you can get in casino games like roulette, so it’s essentially gambling. Most experienced traders target a risk/reward ratio of 1:3 or higher.
How to Calculate Risk/Reward
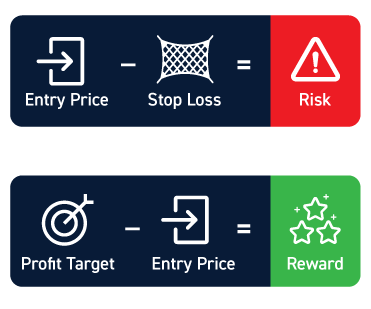
Calculating the risk/reward ratio for a trade requires that you know your entry price, your price target, and your stop loss. Your risk is equal to the difference between your entry and stop loss – that is, the amount you’ll lose if your trade stops out. Your reward is equal to the difference between your price target and entry price – that is, the amount you’ll gain if your trade goes according to plan.
To give an example, say you’re interested in trading shares of Apple. You plan to enter a position at $165 per share and think the price will rise to $180. So, your reward is $15 per share ($180 – $165). To limit your downside, you set a stop loss at $160 per share. So, your risk is $5 per share ($165 – $160). Your risk/reward ratio for the trade is 1:3 ($5/$15).
Considerations for Trading with Risk/Reward in Mind
When using risk/reward ratios as part of your approach to trading, there are a few important things to keep in mind.
First, your risk and reward need to be realistic and accurate. Don’t always determine your price target and stop loss based on a desired 1:3 risk/reward ratio. Rather, you can determine your price target and stop loss first and then calculate your risk/reward ratio.
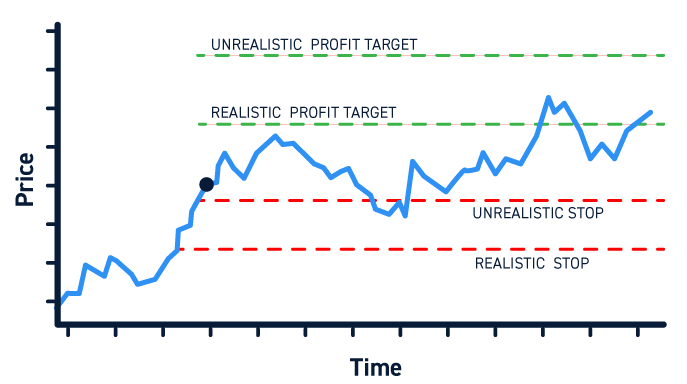
Your price target could be based on a specific resistance level or technical indicator, and your stop loss could be placed below a support level. Look back at your past trades or setups to see how they evolved and determine what your price target and stop loss levels should be.
Importantly, for the risk/reward ratio to be meaningful, you have to stick to your trading plan. If you don’t fully commit to exiting a trade at your stop loss price, then your potential risk is unlimited.
It’s also important to be realistic about whether a trade will work. To go back to the example of Apple shares above, you could achieve a 1:15 risk/reward ratio if you set your stop loss at $164. However, the likelihood that your trade will stop out before achieving your price target is much higher. Think carefully about volatility and support levels when determining what stop loss to use for a trade.
Finally, make sure to think about the amount of money you’re risking in addition to your risk/reward ratio. The amount of money you risk is determined by the size of your position. So, choose a position size that you’re comfortable with in the context of your risk/reward ratio.
Conclusion
The risk/reward ratio of a trade is an objective way to measure how much money you stand to make per added dollar of risk. You can use risk/reward ratio to compare setups and to manage your overall risk while trading. When using risk/reward ratio, be careful about choosing realistic price targets and stop losses. Also remember that your position size determines the amount of money you are putting at risk in any trade. Lastly, the only effective risk/reward strategy is the one that you abide by not matter what your emotions tell you to do.


