

The U.S. stock market has over 6,000 listed stocks moving simultaneously throughout the trading day. To find and filter trading opportunities, seasoned traders utilize the power of stock scanners to optimize their time, attention, and efforts. Taking advantage of computer technology to augment performance is essential in finding and monetizing opportunities in the market.
Why Day Traders Need Scanners
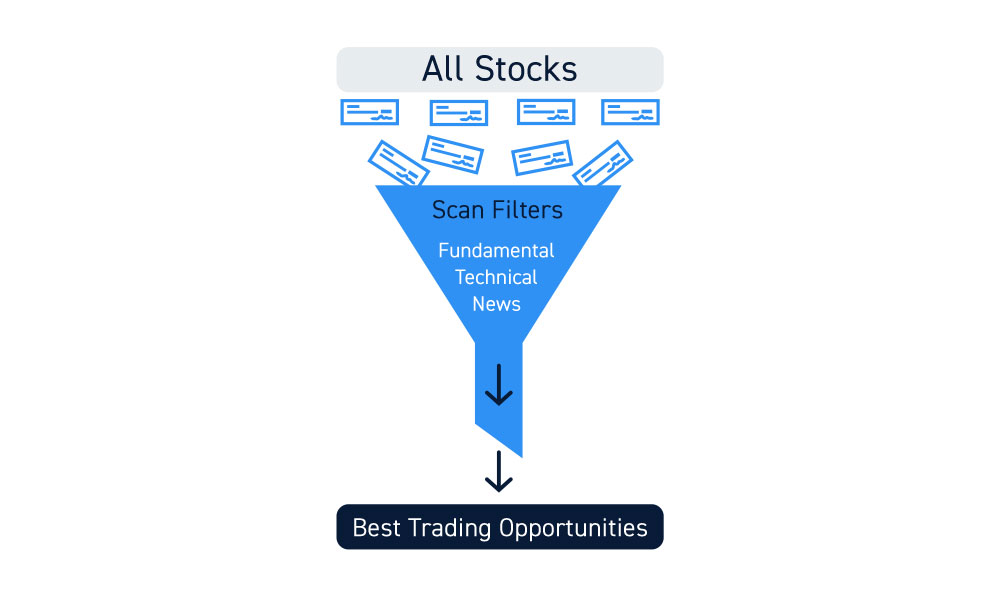
Markets are filled with noise. Being able to filter through this noise to identify tradeable candidates is a key to improving performance as a day trader. Scanners are used to enhance a trader’s agility enabling them to economize their focus on stocks that are seeing the ‘action.’ Traders need to constantly have a pipeline for new opportunities to keep performance momentum fresh. The strongest opportunities will shift between different stocks daily, and a scanner helps you zone in on the action.
What is a Scanner?
A scanner, also referred to as a stock screener, is a program or a service that filters the markets to find stocks that meet a specific set of criteria. The criteria can be preset and also configured by the user. Scanners comb through millions of datapoints to help you find trading opportunities. However, this can be a double-edged sword as well if the trader is too impulsive and lacks having a solid trading methodology. It’s important to understand that a scanner is a tool that can be very useful in the right hands to enhance your agility to monetize opportunities.
Types of Scanners
Scanners search the market to find stocks that match specified criteria. There are two main types of scanners, data scanners, and news scanners.
Data Scanners
Data scanners use criteria that can be pre-set and/or defined by the user. Criteria can be based on technicals referring to stock price action (IE: New Highs, Highest Relative Volume, Double Bottom) and or fundamentals referring to the business financial metrics (IE: P/E, P/S, cash-per-share). Data scanners are the most commonly used, and most traders tend to use the prebuilt scans. These can be real-time scanners which search for intraday trading opportunities or delayed scanners which search for potential swing trade opportunities using end of day data.
News Scanners
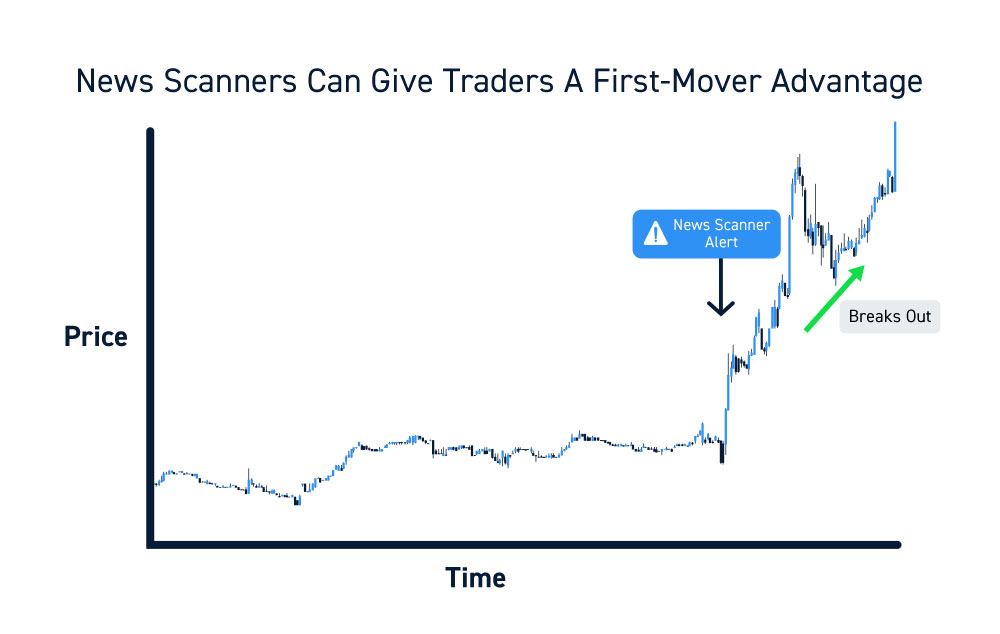
These scanners monitor various newsfeeds to pull information on specific companies or key words that the user provides. The goal is to get a first-mover advantage to find key news items that can move a stock. Users can also use these scanners to also explain what may be driving a powerful price move in the underlying stocks. News scanners are most effective with real-time scanning.
Where Can You Access Scanners?
There are various forms of scanners available at different price points. Keep in mind that you tend to get what you pay for.
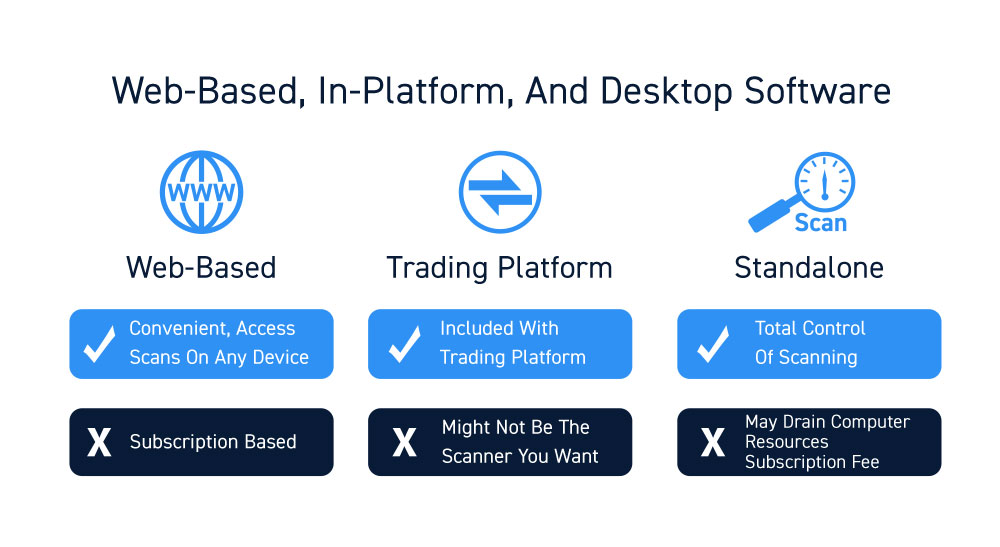
Web-based scanners tend to be subscription based with the resource heavy lifting being done on the provider’s computers and pushing results to your browser. These are very convenient when you need to access scans away from your desktop.
Trading platform scanners are a feature embedded within your trading platform. These are provided by your broker and can range from simple to sophisticated with prebuilt scans and customizable scans.
Standalone desktop scanning software gives you total control of your scanning as you can input and program criteria as well as control the dataset. The downside is that scanning is a resource hog when housed on your own system. Therefore, some traders will only run the scans manually or limit the sample size of the scans to specific lists of types of stocks.
How to Build a Great Scan
For day traders that wish to customize their scanners, here are some tips on how to build a great scan.
STEP 1: Define the trading opportunities you are looking for
Before you define your scanner settings, you need to know what types of opportunities you are looking for.
- Are you looking for breakouts to play the long side or breakdowns to play the short side?
- Are you looking for pullback entries on uptrends or downtrends?
- Are you looking to play only stocks trading above $50.00 per share?
- Are you looking for stocks trading at 5X relative volume when a breakout occurs?
These questions will help you define the criteria for your scan. You need to know what you’re looking for in order to specify the criteria for instructing the scanner to find specific opportunities. This also requires having a trading methodology or system so that you know exactly which set-ups you prefer to play.
STEP 2: Translate These “Opportunities” into Quantitative Criteria
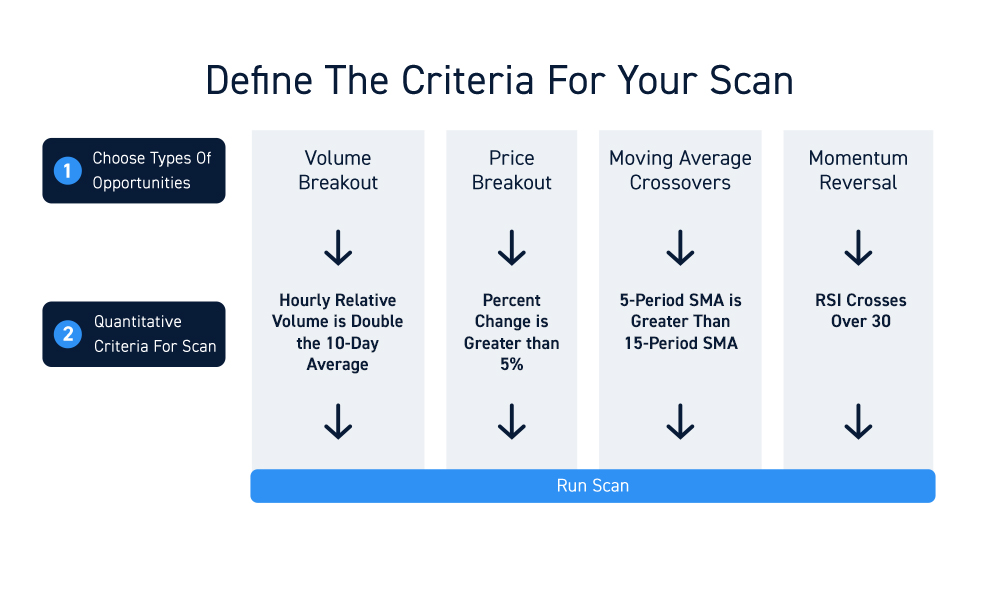
Once you define the kind of trading opportunities you’re searching for by defining the set-ups, it’s time to translate the set-ups by the individual components quantitatively. It’s important to be very specific in order to attain precise candidates.
For example, you can’t just tell a scanner to look for “breakouts,” “good opportunities,” or “stocks making big moves.” You need to find a way to turn these into quantifiable scanning criteria.
Here are some examples:
- Volume Breakout: Hourly Relative Volume > Double the 10-day average volume
- Price Breakout: % Price Change > 5% of Last Close
- Moving Average Crossovers: Daily 5 period moving average crossover up through 15-period moving average
- Momentum Reversal: Daily RSI crossover up through 30
STEP 3: Start Building Your Scan
Once you’ve defined your set-ups, it’s time to input the criteria into your scanner. Make sure you specify the time frames. Intraday trading may require intraday time frames utilizing 60-minute, 15-minute, and or 5-minute signals. Swing traders can utilize wider time frames like the daily, weekly, and or monthly.
STEP 4: Test, Analyst, and Repeat
After building your scan, make sure to manually monitor each stock to gauge the accuracy of the scan. As you go through the results, make sure to note which candidates continue to follow through on the set-ups and which end up being false positives.
Examine the false triggers to find out what component was lacking in order to refine or add to your criteria. For example, you might decide you need more momentum for breakouts to follow through and raise the RSI crossover to 40 from 30. Be vigilant and detailed during this process.
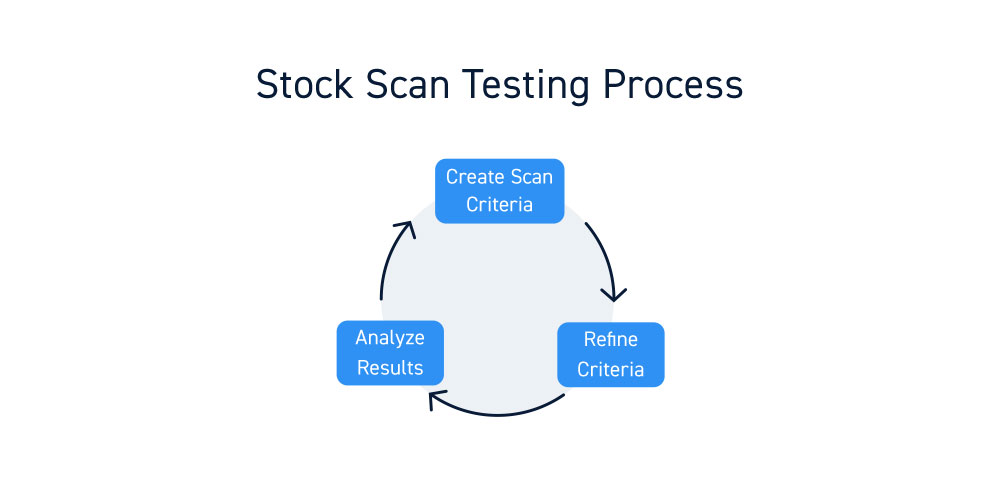
The goal is to continue to refine your scans to produce the finest qualified candidates ready to trade your methodology.
Final Thoughts
The goal of using a stock scanner is to enhance your agility and efficiency as a trader. It takes effort to build great scans. By doing so, it also trims down your own legwork to focus on managing the trade, rather than finding the trade. The key is the quality of scan results, never quantity. Most importantly, don’t spread yourself too thin by hopping on every candidate. This is a common pitfall for beginners. Always plan your trade and trade your plan.


