

As the stock market continues higher, you hear the term bull market constantly as it applies to stocks. It’s a common term, but what does it really mean and how can you trade it? Is a bull market just when the markets go higher on a single day and does it still apply on very red trading days?
What is a Bull Market?
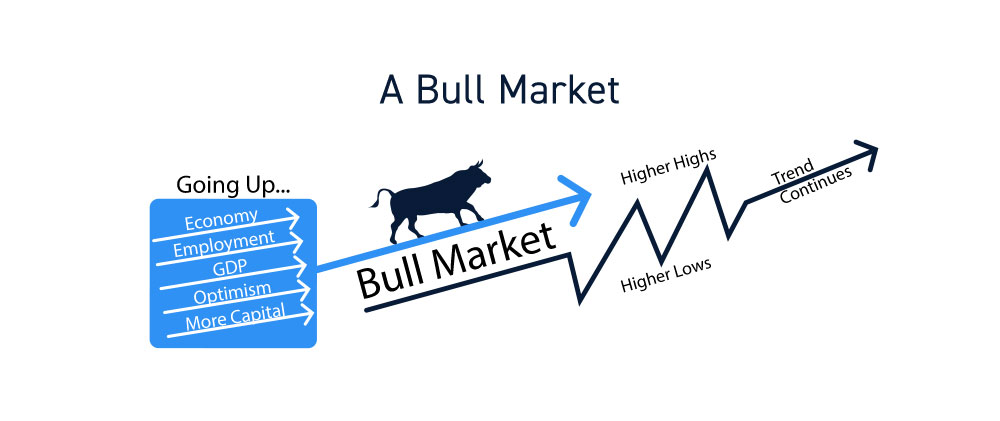
A bull market is a condition defined as a market that continues to trend higher or uptrend. An uptrending market is one that makes higher highs (extensions) and higher lows (pullbacks). This uptrend pattern applies to all financial assets and instruments and can be applied to multiple time frames. In reference to a bull market, the uptrend is applied on a wider time frame that can range from days to months. Usually bull markets are applied to benchmark indexes like the Dow Jones Industrial Average, S&P 500 index, and the Nasdaq index. It generalizes the stock market to basically rising or falling. It’s label stems back to the notion of a bull’s horns rising up as it charges. Whereas a bear will claw down as it attacks. Keep in mind that not all sectors, industries and stocks will rise in a bull market, but most tend to follow the indexes higher.
Criteria
The criteria for a bull market starts with a continuous uptrend in equity index prices while the economy is also exhibiting signs of growth. This means employment levels are high as the economy continues to strengthen as measured by gross domestic product (GDP). As with any strong market, demand tends to outstrip supply thereby causing prices to rise. A bull market continues higher because the demand for stock pushes prices higher as sellers raise their offers or decide to just ride the uptrend, thereby providing less supply. Investors are typically optimistic about the economy, employment, financial stability and thereby have a proclivity towards adding more capital to their investments. As prices rise, they tend to continually rise as participants buy the dip on pullbacks thereby generating higher lows in addition to driving higher highs.
Economic Implications
The underlying economy tends to be improving as evidenced by expanding GDP and falling unemployment. Wages tend to rise in a bull market and companies continuing hiring as they finance growth with low interest rate loans and debt. This is an expansion period which also sees rising real estate prices, commodities prices, and inflation. Low interest rates spur economic growth as “cheap” money enables companies to invest and reinvest in projects and expansion.
History of Bull Markets
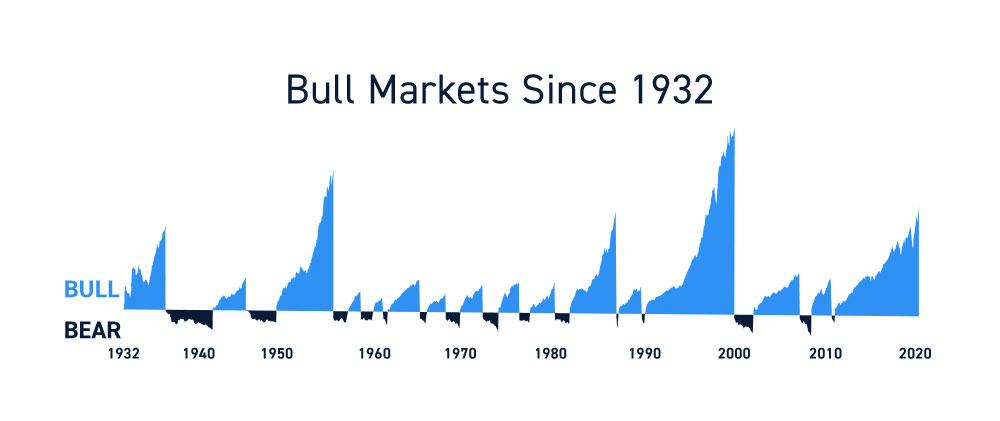
There have been 14 bull markets since June 1932. The average length of a bull market is 3.8 years with the longest bull market being the 11 year run from 2009 to 2020, just before the COVID-19 pandemic collapsed the markets.
Historical examples
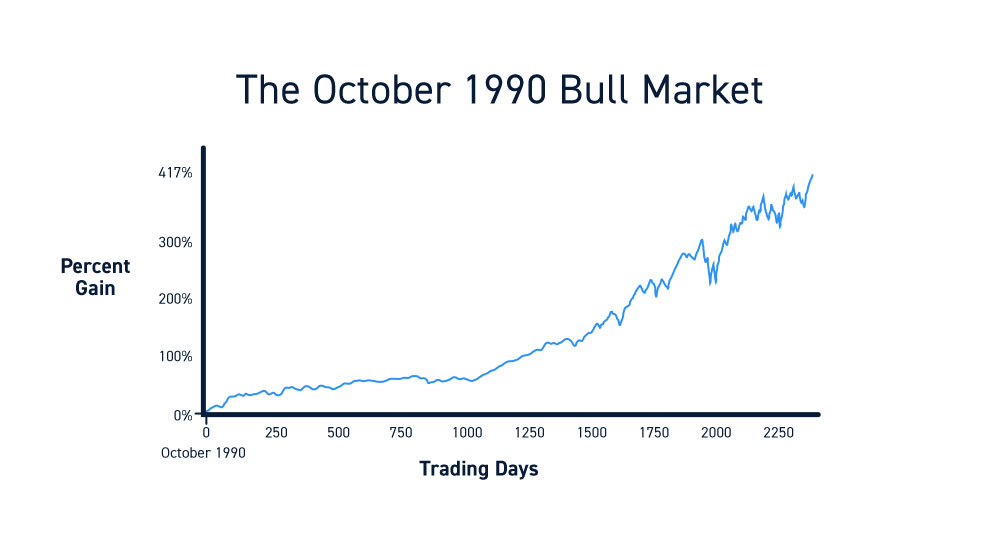
The largest percentage gainers for bull markets is the October 1990 bull market that generates a 417% return off the lows and the March 2009 bull market that triggered after the financial markets meltdown and housing bubble. That bull market extended to March 2020 generating a 400.5% return on the S&P 500 before the pandemic black swan event pummeled markets. The recovering bull market generated a 51.5% return as of March 23, 2021.
How long do bull markets usually last?
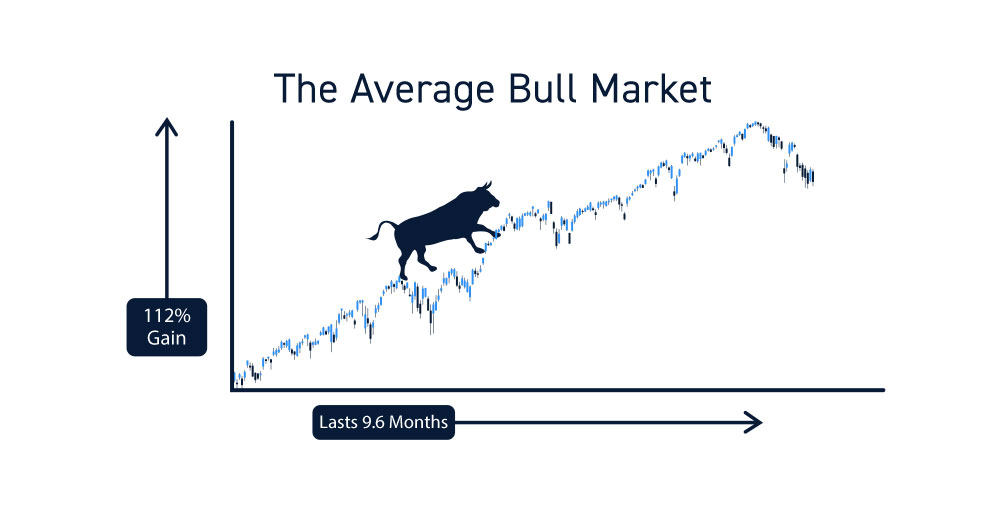
Historically speaking, the average length of a bull market is 9.6 months. The average gain for a bull market is 112%. Keep in mind these are the average and they have been extending with each bull market.
Things to Be Aware Of in Bull Markets
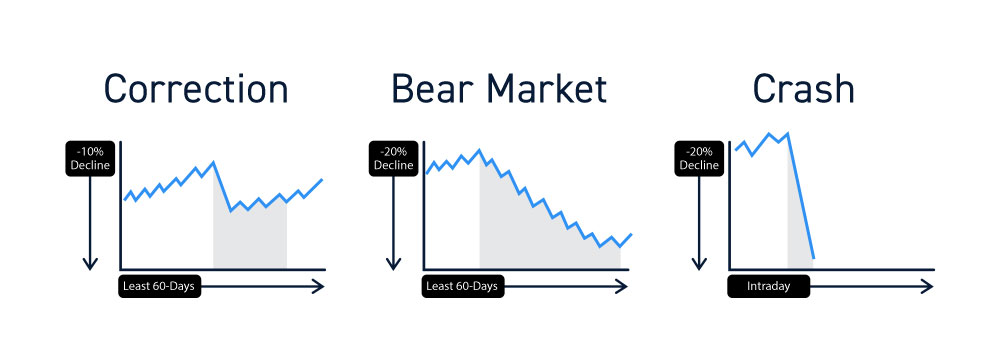
Corrections vs. Bear Markets vs. Crashes
A correction is technically considered when markets fall (-10%) from its highs for at least 60-days.
When markets fall (-20%) or more for at least 60-days, then a bear market has arrived.
A crash happens when markets collapse abruptly and extremely in a small period of time. While there aren’t any specific definitions of what percentage drop constitutes a crash, one can assume a (-20%) or more drop intraday on the benchmarks would be considered a crash. There are trading circuit breakers/trading curbs in place to soften the blow where trading is halted for periods of time. These can also backfire as selling pressure builds during the halt and is displayed when the halt is lifted.
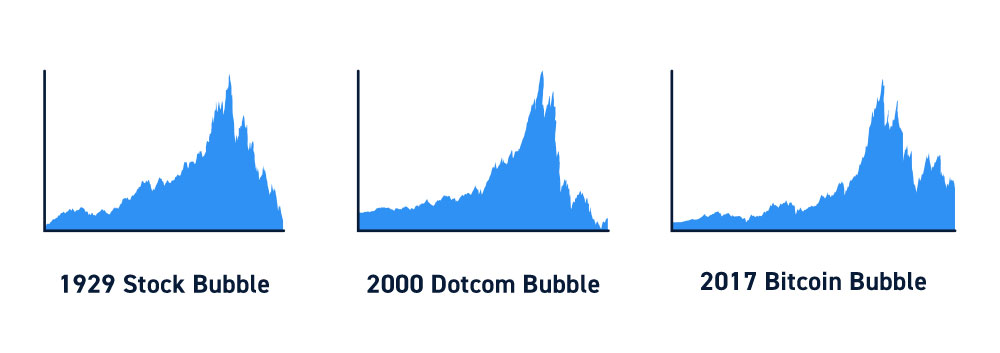
Bubbles
Bull markets have a habit of heating up too much to create a bubble. As stock markets bounce off lows and then proceed to break highs, it causes the fear-of-missing-out (FOMO) as traders and investors chase markets higher. The longer a bull market goes up, the greater the chance of a bubble. Often times, bubbles form when everything looks “great”. Valuations are expensive but the uptrend appears to want to continue higher. The other factor to remember is that bubbles are only viewable in the “rear view mirror”. In other words, bubbles aren’t identified until after they implode. Bubbles tend to usher in bear markets as the economy and stock market may have overheated.
Trading in a Bull Market
Here are some tips to take into consideration when trading in a bull market. Remember, active intraday traders often focus on the extreme short-term price action and often times miss the forest from the trees. It’s important to always gauge if you are trading in a bull market and adjust your strategies to accommodate conditions. Make no mistake, traders do lose money in bull markets so it’s prudent to take these tips into consideration.
Momentum Favors the Upside
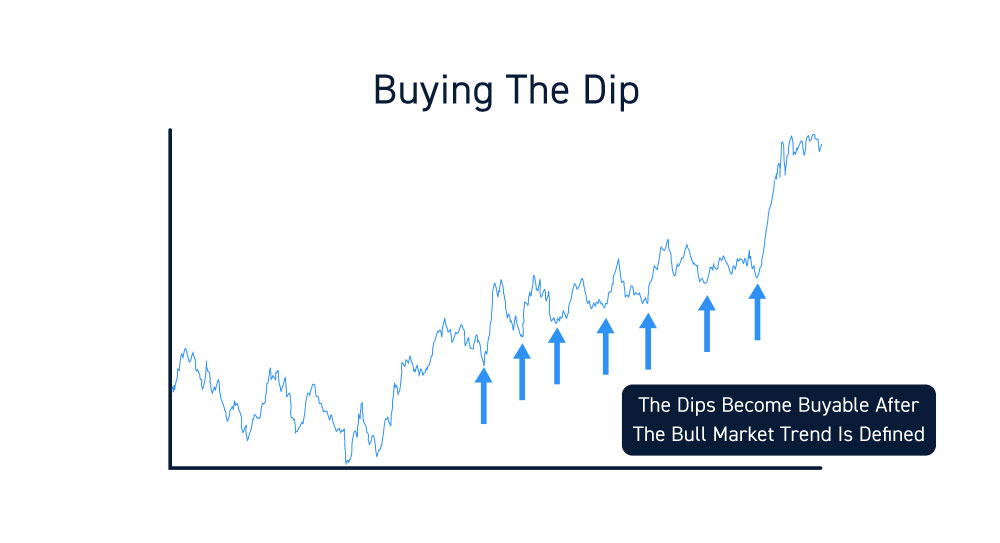
In bull markets, a rising tide which lifts all boats tends to apply. While not all stocks will rise every day, the general direction tends to be up. Money rotates constantly and certain sectors will rise more than others, but eventually all sectors tend to rise in the context of a bull market. Buy the dip tends to be a popular trading strategy in a bull market since stocks eventually rise during the positive sentiment.
Sentiment is Overwhelmingly Positive (Greed vs. Fear)
With such positive general sentiment, it’s easy to get greedy. In fact, greed tends to override fear unless in cases of fear-of-missing-out (FOMO). This tends to happen when retail investors continue to see the markets or specific stocks rise day in and day out and end of chasing stocks. This happens everyday in the markets as traders tend to chase tops more often in bull markets.
The Majority of Stocks Follow the Market
Again, a rising tide (tends to) lift all boats. Most major stocks follow the indexes and tend to move higher with the benchmarks. Some small-cap stocks tend to be less correlated with larger benchmark indexes but may follow the small-cap benchmark indexes like the Russell 3000. Some stocks (i.e. small caps) may not be correlated with broad market trends so make sure that you are using the particular benchmark as a compass when trading them. The stock market has been commonly trading with divergence at them between the SPY, QQQ and DIA benchmarks. Therefore, make sure whatever stocks you are trading is correlated with the correct benchmark. Usually banks and financials move best with the SPY and DIA, while technology stocks tend to move with the QQQ.
Stocks May Have More “Staying Power”
Bull markets tend to have longer periods of uptrends which tends to throw off short-sellers, who in turn end up covering by buying back shares further driving prices higher. Uptrends tend to last longer and get overextended but continue to rise. Be careful holding onto shorts too long in a bull market. It all stems back to the time frames you are playing and the general context of the wider trends.
The Market May Attract More Amateur Retail Traders
The latest bull market has seen a resurgence in day trading with new participants entering the markets thanks to zero-commission apps and the pandemic. Seasoned day traders welcome the new amateur retail traders as they can provide more momentum (from chasing) and liquidity as participants increase. If you happen to be a beginner, then make sure that you have a trading methodology in place.
You Can Still Play Both Sides of the Market
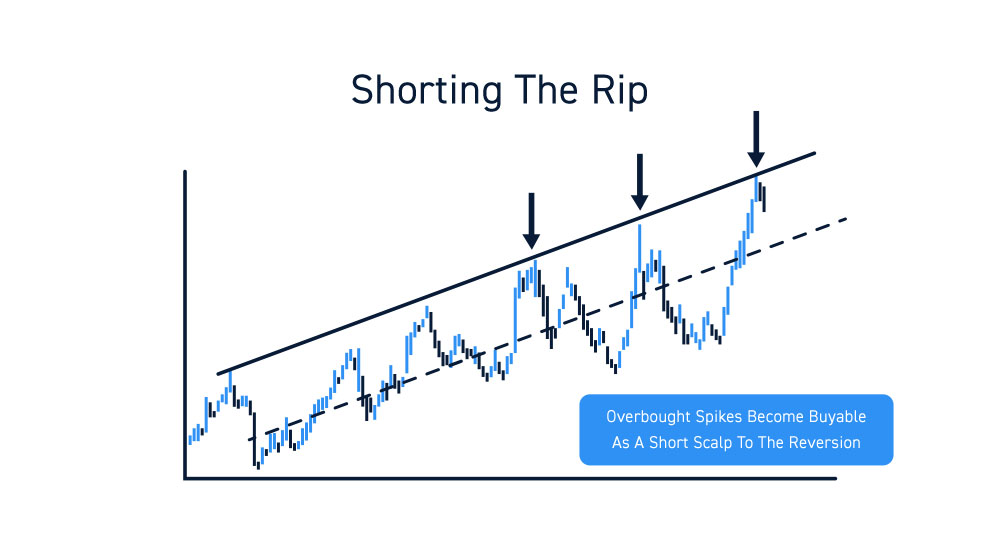
This is very important for intraday traders. Focus on your specific time frame in which you’re trading. A stock may have a strong daily uptrend, but in the process have a strong pullback intraday. In this situation, you would likely consider either buying the dip near support levels or short selling the reversion down. Just because you are in a wider time frame bull market, doesn’t mean you always have to play on the long side only. Bull markets tend to reward buying the dip, as long as you know where supports are. Shorting the “rip” is also a popular method of trading involving short-selling extreme overbought spikes to scalp the reversion.
Pay Attention to Trends
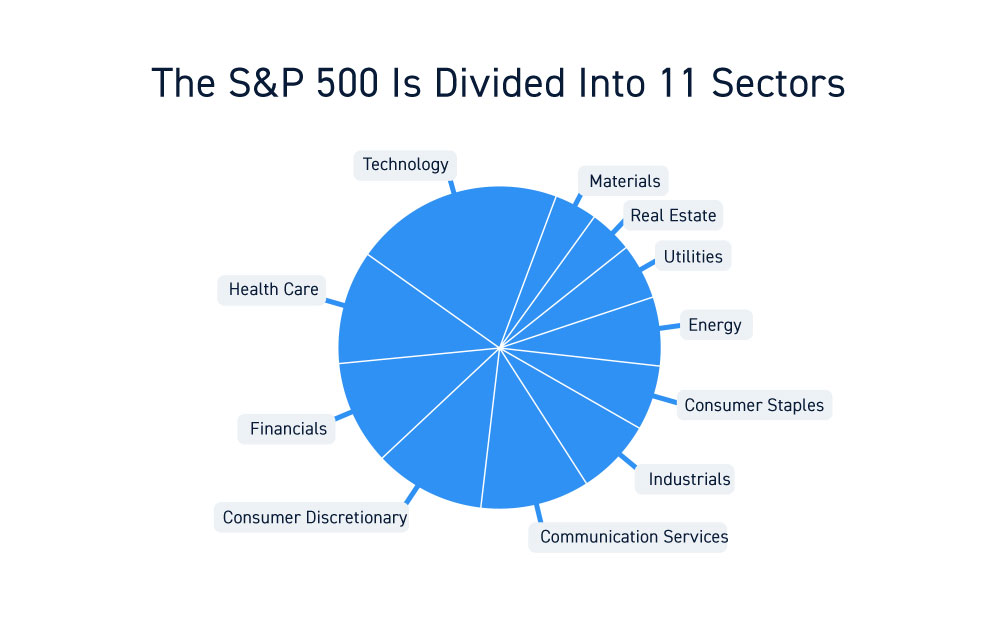
On any given day in a bull market, certain sectors will tend to outperform the rest of the market. Be aware of the 14 different sectors in the S&P 500 index. If you specialize in just one or a few sectors, make sure you are aware of the leaders in the sector to play the correlation (or divergence).
Be Aware of the Market Leaders
Each sector has leaders that tend to move first and set the tone while the smaller peers tend to follow. Again, be aware of the 14 sectors and the leaders in each sector. These can also be tracked with exchange-traded-funds (ETFs) and/or a heatmap. Generally, the leaders are the ones that carry the rest of the market or the benchmark indexes, so it pays to be aware of them.
Focus on multiple sectors and indices
As pointed out, some sectors will be strong while others are weak on any given market trading day. Use a heatmap and have the ETFs to gauge which sectors are strong, and which are weak. You don’t have to trade the leaders, but rather use them as a leader indicator to trade the lower tier peer stocks. If the momentum is strong enough in a sector, the money will naturally flow down to the lower tier peer stocks and vice versa.
Be on the Look Out for a Change in Sentiment
Be aware of the technical price levels that can trigger a correction or a bear market. Prices move on narratives, which influence sentiment which then moves prices. However, price moves that are extreme can impact sentiment and change the narrative. Always keep your hand on the pulse on the market and keep your ears to the ground. This can be observed by watching the leaders in the sectors as well as knowing the technical support and resistance levels that can determine a market reversal to a bear market.


