

You probably heard the term gamma squeeze in reference to meme stocks and short squeezes. While buying causes stock prices to rise, panic buying can create an extreme scenario causing spikes to violently rip higher. As the stock soars, the buying pressure increases to levels deemed ridiculous.
What is a Gamma Squeeze?
A gamma squeeze is the culmination of sharp stock price spikes due a number of different types of buyers in the underlying stock.
A gamma squeeze forms when a stock price is rising rapidly due to the underlying calls spiking on super heavy volume. The call volume may spike 100X the normal volume, like a surprise tsunami, taking the market makers off guard and forcing them to buy stock in the open market to hedge the calls.
Momentum traders are tipped off and pile into stock further perpetuating the stock spike. The fast surge in share prices cause short-sellers to scramble as they try to cover to limit losses or buy more calls to hedge their positions.
This causes more buying pressure pushing the stock higher and causing calls to spike m
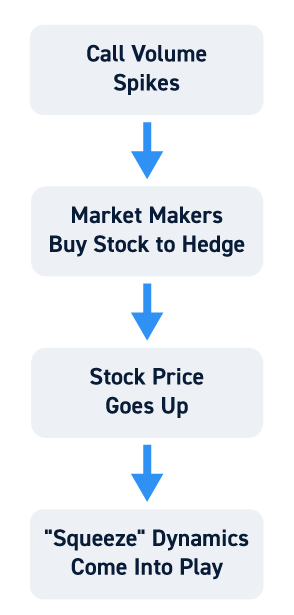
ore. This cycle repeats itself as the stock skyrockets. If it’s a heavily shorted stock, the price upside explosion can further exaggerated.
A gamma squeeze can last from hours to weeks. Consider it like the tail wagging the d
og in an extreme fashion as investors and market makers are forced to buy shares.
Let’s take a closer look at the mechanics of a gamma squeeze.
What are Gamma and Delta?
Gamma and Delta are two of the “Greeks” used in options trading. Options “Greeks” are used to better understand how options may trade.
In order to understand Gamma, you first need to understand delta. Delta measures the rate of change in an option based on a $1 change in the underlying stock price. For example, a delta of $0.50 implies that the option contract will increase/decrease by $0.50/contract for every $1 increase/decrease in the stock.
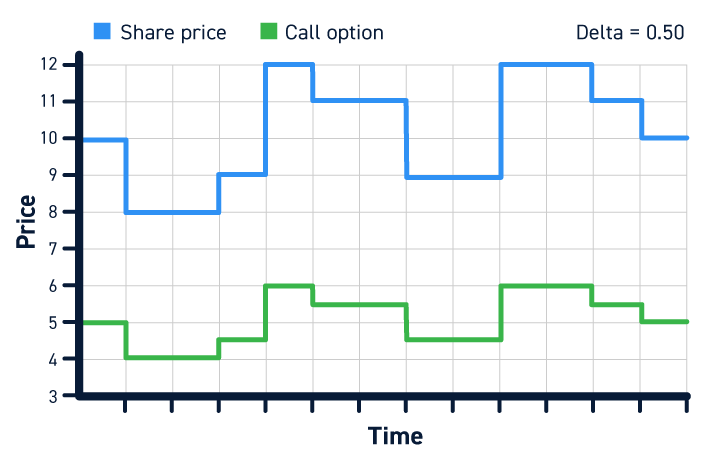
Gamma measures the acceleration of the delta, like a speedometer. A high gamma indicates high acceleration in the underlying stock price.
How Does a Gamma Squeeze Work?
To understand how a gamma squeeze works, it’s important to understand how institutions and options market makers buy, sell, and hedge risk and the mechanics of market making. Options can be bought long or sold short.
If you sell short a call option, you are expecting the underlying stock price to fall. If you sell a put option, you expect the underlying stock price to rise. Just like shorting a stock, selling a call option has unlimited loss potential if the stock surges higher.
The Mechanics of a Gamma Squeeze
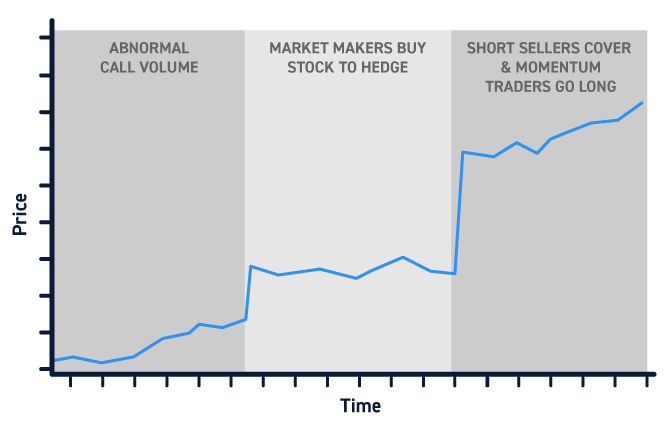
Stage 1: The Spark
Institutions regularly sell puts expecting the underlying stock to rise but are obligated to buy the shares if they fall under the strike price.
Many institutions and hedge funds will sell/short calls in order to collect income (covered calls or naked shorts/sells). If the stock surges in price and the institution is naked short on the calls, they must either buy the underlying stock or buy the calls back at a higher price.
The buying can actually cause prices to rise further as demand grows. Options premiums rise as the stock accelerates quicker and gamma spikes. For anyone naked short the calls, gamma is their worst enemy as options get priced more expensively as they chase to cover.
Stage 2: The Fire
Just like institutions, market makers have portfolios of various options and strikes. Most of these positions tend to be hedged. However, when a tsunami of call buying happens, they can be caught off guard without a hedge. With the over-selling of calls, market makers need to have the adequate shares to get their delta close to zero. This causes options market makers to frantically buy shares in the open market in order to hedge the call options.
As the prices spike ,they lose money on the calls that are not hedged with the underlying shares. The faster they accelerate the delta, the higher the gamma rises.
Stage 3: The Gasoline
As share prices rise, it also invites in speculators and momentum traders that pile on top of the longs. This also causes short-sellers of the stock to get concerned and start buying to cover to limit losses.
Short-sellers might not only get margin calls but forced liquidation as their brokers automatically cover their shorts by buying in the open market. As the shares continue to rise, the inventory of borrowable short shares will plunge making it hard-to-borrow (HTB). This action traps short-sellers with no choice but to buy stock and calls to cut losses and hedge or wait it out for a reversion.
All these elements happening simultaneously in a perfect storm causes a gamma squeeze. The cycle continues and repeats itself as shares rise higher quickly.
What is the trigger that kicks things off? That’s the key question. Often times, it will be speculators that suddenly dive into the calls like a tsunami triggering a gamma squeeze on news, rumors, or trends. Many times, the gamma squeeze occurs absent any news.
Gamma Squeeze Example
Gamma squeezes can be difficult to understand at first, so let’s apply our discussion to a hypothetical example.
Assume stock XYZ is trading at $20:
- The total average call and put volume may be 2,000 x 1,500 on any given day.
- The stock has a 25% short interest on a thin 30 million share float
- The stock has an average daily volume of 1 million shares a day.
On Monday, there is a rumor that the company will be bought out at $50. The stock immediately surges from $20 to $27 premarket, catching short sellers and options market makers off guard.
Since the options market doesn’t open until 9:30 am EST, they are quickly buying shares to hedge their positions.
As the market opens, short-sellers frantically try to cover some of all of their shorts by buying shares or calls. Call volume surges to 20,000 contracts of volume by 10 am EST.
The stock dips slightly on the open and immediately surges to $30. At this point, buying pressure surges as short-sellers try to cover, speculators try to buy the rumor, momentum players attempt to buy and trigger short squeezes.
Margin calls start to trigger and forced liquidation occurs pushing up prices past $33 by 10:15am.
Two simultaneous squeezes are in effect, a short squeeze on the shares perpetuated by the gamma squeeze on the calls. By the end, shares double to $40 with over 200,000 calls to 20,000 puts in volume and over 200 million shares traded on the day.
Real Life Gamma Squeezes
The age of the gamma squeeze and meme stocks was kicked off by GameStop in 2020. Shares of GameStop were heavily shorted beyond its float (140%) as short-sellers were expecting bankruptcy stemming for a failing business and store closures to the pandemic.
Shares squeezed from $4 on 17 million shares volume April 20, 2020 to $19 on Jan. 4, 2021. From Jan. 22 to Jan. 26, GME shares squeezed from $42.30s to a high of $483 on Jan. 25, 2021 as shares exploded on one of the largest gamma squeezes in history.
This kicked off the era of “meme” stocks are traders piled into sympathy plays like AMC Theatres, KOSS, Blackberry, and Bed, Bath and Beyond shares to name a few. The lesson here is to be aware of spikes in gamma to avoid being on the wrong side of a gamma squeeze.


