

Have you ever wondered what the difference is between different market participants?
Every market participant has a different behavioral pattern that may impact the price of a stock.
Stock ownership is a summarization of market participants. The distinction can mean the difference between “paper hands” and “diamond hands” as it relates to holding times and pain thresholds. Let’s delve into the how different types of stock owners can impact its price behavior.
What Causes a Stock Price to Go Up and Down?
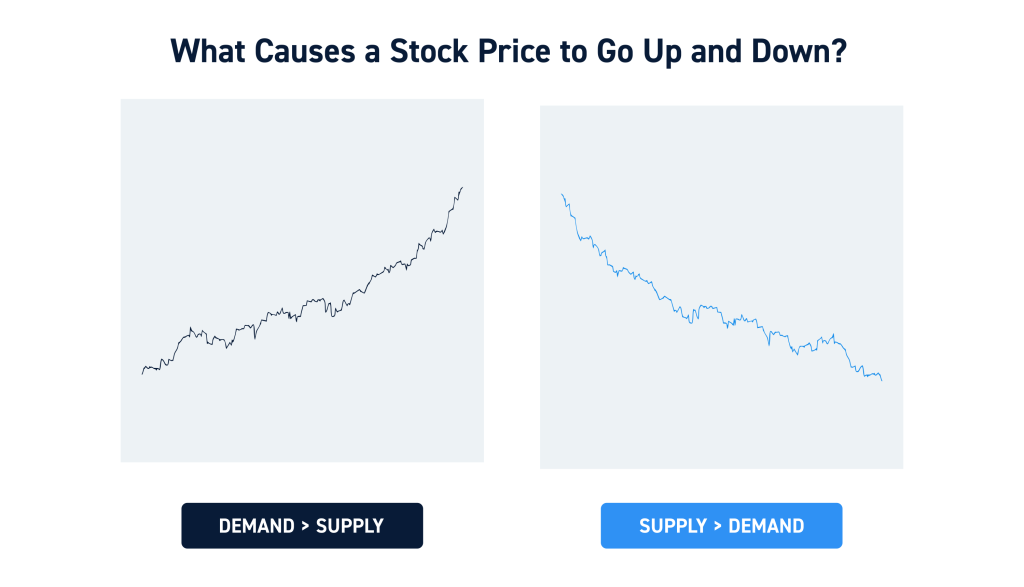
The driving force behind stock price movement is supply and demand.
Buyers typically represent demand and sellers represent supply. When there are lots of buyers and less sellers, this causes prices to rise as demand overwhelms supply. Sellers realize that buyers are hungry for shares and thus lift their offering (selling) prices. Buyers are anxious to get shares, so they are willing to up their bids and chase prices to ensure a fill. Vice versa, when sellers overwhelm buyers, prices tend to fall.
Supply and demand dictates stock price. However, market participants dictate supply and demand. Therefore, it’s important to understand who you are trading with so you can better gauge potential supply and demand levels.
Why Should Traders Care About Other Market Participants?
So, the question often arises, “Who is buying the stock and why does it matter?”. This is where it pays to understand the characteristics and intentions of different type of market participants.
Different participants have different trading styles that will impact how a stock trades. Retail traders, retail investors, and institutions all have different goals and timeframes. While you can’t get an exact breakdown of a stock’s ownership, you can combine data and educated analysis to determine how a stock may trade.
Let’s take a look at some of the most common market participants and how they may impact a stock.
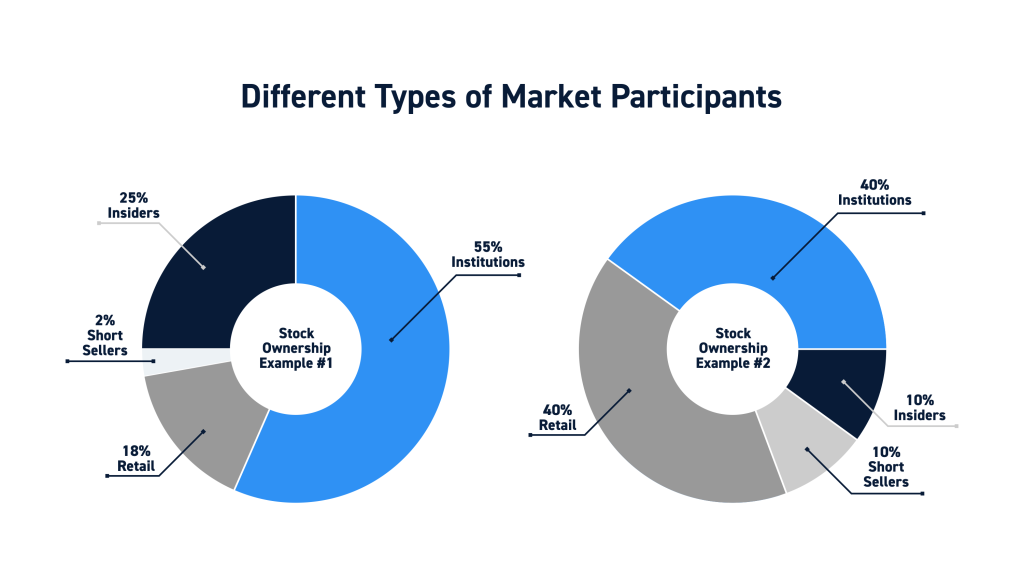
Different Types of Market Participants (Stock Ownership Groups)
There are four types of market participants to be aware of. Let’s review the general habits and intents of each group.
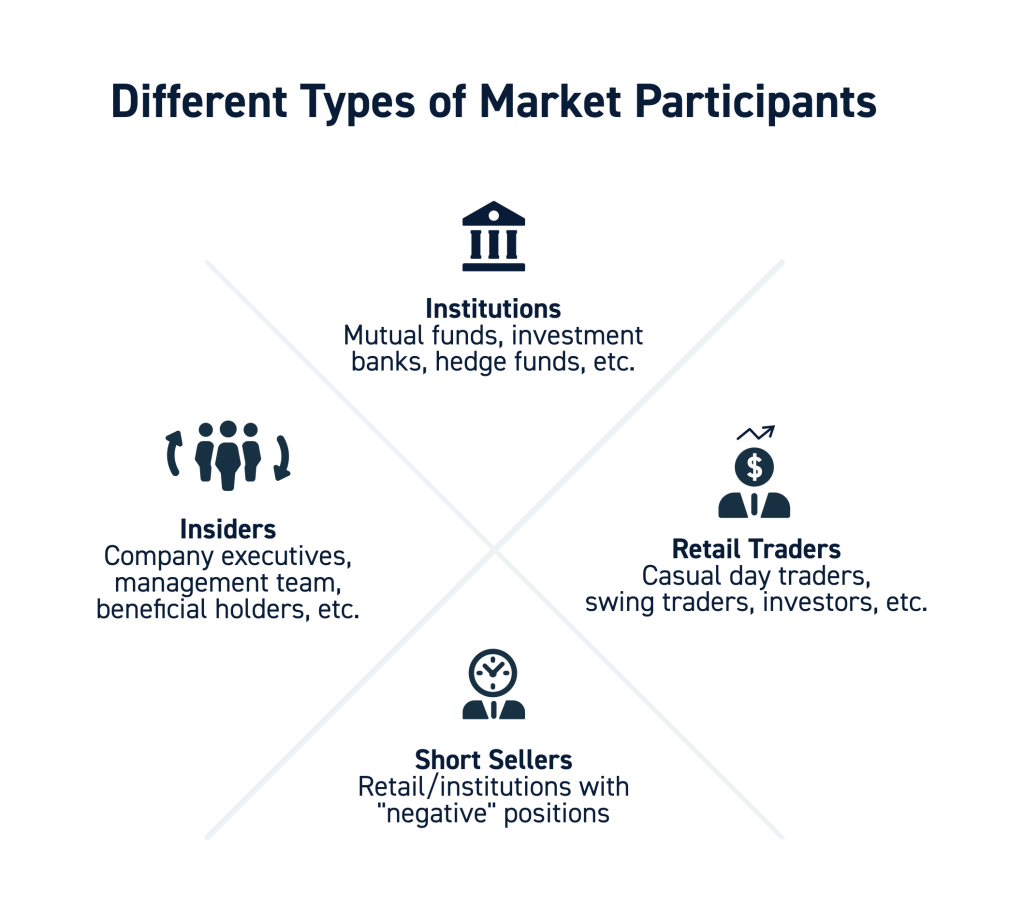
Institutions
Institutions represent the “big money” in the markets. This can involve mutual funds, investment banks, hedge funds, pension funds, and even sovereign nations. Institutions are the dinosaurs that move stock prices and stabilize stock prices. They buy massive amounts of shares and usually spread the buying through different brokers over time to avoid too much market impact. Institutions can impact the market by locking up the float, by thinning it out with massive buying or capping the price rise is they are sellers. As the say, “Dinosaurs can not walk in the sand without leaving footprints” describes the impact and trading behavior of institutional holders.
Metrics to Focus On
Any lasting price movement up or down is likely due to institutional involvement, especially in the widely traded stocks. It’s often said that the name of the trading game is to try to ride the coattails of institutions to take profits along the way. Institutions are usually long-term holders that scale into positions. There are some key metrics to be aware of to gauge institutional activity.
Institutional Ownership Percentage
Institutional ownership is high-quality ownership that tends to hold long term. Institutions are not trying to day trade or capture minimal price moves like a scalper. As more institutions take ownership in a stock, the more stable the price tends to be. Be sure to check the percentage of institutional ownership in a stock to gauge who the “diamond” hands are. This information can be found on the internet as it can be broken down not just into how much of the float is owned by institutions but also the top five to 10 institutional holders. This is because institutional owners must making filings (EG: 13-D) on their portfolio position holdings, especially when they surpass a certain percentage of outstanding shares.
Popular Institutional Indicators
The name of the game is to game the institutions by stepping in ahead of them or with them. Utilizing chart indicators like volume weight moving average (VWAP) helps to visualize not necessarily on the trend but also a support and resistance line in the sand. Additional variations like time weight average price (TWAP) combined with various moving averages and a momentum indicator like stochastic or MACD can be effective in creating a trading system that helps to interpret price action.
Insiders
A company’s executives (directors, senior officers) or beneficial holders with 10% or more of the common shares are considered company insiders. Since these people are in high level company positions with access to sensitive information, its assumed they are privy to material information that could impact stock prices. Therefore, these insiders are required to make SEC filings when they intend to sell or have sold shares in the company. Insiders must also file when they make purchases of company shares either in the open market or through exercising options or grants. Insider activity, especially buying, can impact stock prices immediately.
Metrics to Focus On
The insider ownership percentage can impact the liquidity of the float. Insiders tend to be long-term holders and thus a high level of insider ownership may provide stability in prices and creates the image of having “skin in the game” for them. However, if there is too much insider ownership that’s tilted to a few insiders, this can actually cause more volatility as any sentiment shift can immediately tank shares.
Insider Buying/Selling Activity
When insiders are buying shares, it gives am impression of confidence and insiders being enthusiastic in the performance of the company or an upcoming catalyst. Insider buying can be found on various websites that track filings. Insider selling can dampen the sentiment in shares as investors are wondering why the insiders are unloading shares. Be aware of initial spikes or drops and then often a reversion back to the mean.
Retail Traders
These are the “little” guys including active day traders, swing traders and active investors. Usually, retail traders are at the bottom of the totem pole in terms of capital, access, speed, and strategy. The skill levels can range from commission-free app based newbies to direct routing and algorithmic traders.
Retail trading Behavior vs. Institutional Trading Behavior
Retail traders tend to have much shorter holding times that can range from mere seconds to hours. This can result in sharp stock price moves that tend to collapse quicker and deeper. Retail traders tend to chase and many end up as bagholders in a game of musical shares. The net price movement may be little in the course of days to weeks. Institutions tend to scale into larger positions that are held longer term. They aren’t scalping a position for a $0.50 profit, instead looking for much larger price gains.
Interestingly, 2021 seems to have ushered in the age of the meme stocks where retail traders are able to impact stock prices for longer periods of time as illustrated by GameStop and AMC Theatres, which started as short squeezes causing institutional short sellers to cover.
Short Sellers
Stock prices can also be impacted by short sellers. Short sellers expect share prices to fall, and the holders can range from retail traders to institutions. Short sellers can pile into a stock and caused it to collapse, especially when they release a damaging report to damage the sentiment. On the flipside, short sellers can also trigger a short squeeze that causes price spikes as they actively try to cover their positions by buying to close.
Short Percentage of Float
The key metric to watch is the percentage of short float number and the trend of increasing or decreasing by the month. The short interest is published once a month to illustrate sentiment in shares. When the short percentage gets lofty, this creates a crowded trade that is susceptible to short squeezes. Typically, stocks that have over 20% of its float short are prone to having periods of short squeezes. Retail traders often stalk stocks with high short interest in order to trigger short squeezes. It’s very important to know the short percentage of the stocks you trade.


