

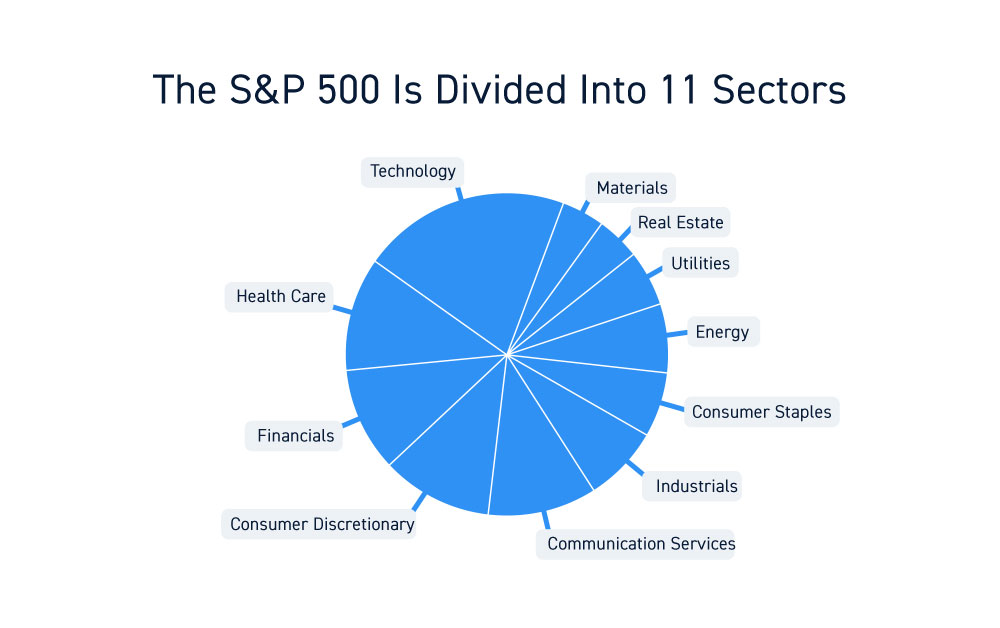
The Standard & Poor’s (S&P) 500 is a benchmark index that tracks the stock performance of approximately 500 large-cap publicly traded companies that represent the pulse of the U.S. economy. It’s grouped into 11 sectors and respective individual industries within them (IE: financial sector and banking industry). It’s also a market-cap weighted index meaning that companies with larger market caps (Stock Price X Shares Outstanding) will make a greater impact on the value of the index. The S&P 500 provides a more comprehensive gauge of the U.S. economy than the Dow Jones Industrial Average which is limited to only 30 stocks.
History of the S&P 500
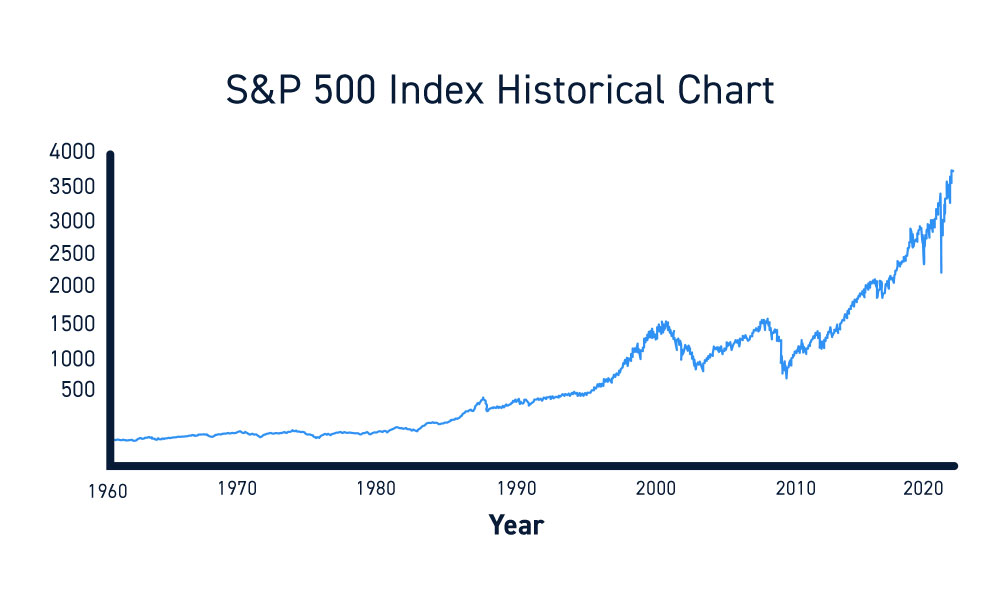
Ratings agency Standard & Poor’s originally created the S&P 500 index in 1957 as a more comprehensive gauge of the country’s 500 largest corporations. These high-quality companies were listed on the New York Stock Exchange and the NASDAQ. The value of the S&P 500 grew to 700 points during its first 10-years representing the bull market experienced after World War II.
Ultimately the index experienced sharp bear markets often preceding economic contractions falling below 300 in the decade leading up to 1981. However, the index has always recovered and thrived during bull market cycles. Notable bear market selloffs include the more than a (-50%) drop during the 2000-2001 technology bubble, the 2009 financial meltdown and the (-34%) plunge during the coronavirus pandemic in 2020. The S&P has been able to effectively recover and grind towards new all-time highs after every bear market reaching all-time highs of 3,580 on Sept. 2, 2020.
S&P 500 Stock Selection
Standard & Poor’s routinely decides to adjust the index component stocks when existing Companies are underperforming. New S&P 500 index candidates are selected based on market-capitalization, industry leadership, operational performance and liquidity. The actual selection process is proprietary to Standard & Poor’s and known only by the S&P index committee. Since the S&P 500 is seen as the bell weather of the U.S. economy, companies need to be representative of the nation’s economic performance. For this reason, stocks are often swapped out and replaced with more relevant companies accommodating current and future trends.
Important Things to Consider When Analyzing the S&P 500
The S&P 500 is a benchmark macro gauge of the U.S. equity markets, investor sentiment, and the U.S. economy. When the S&P 500 is rising, it tends to lift stock prices across the board. However, there are nuances to be aware of when analyzing the S&P 500. It’s not an exact science and can diverge for long periods of time. The index often precedes economic activity like recessions and expansions.
Companies are Not Equally Weighted
Since the S&P 500 is a market-cap weighted index, stocks with the largest market capitalization will make larger impacts. This can be problematic when momentum chases a handful of stocks, which causes the index to accelerate higher but provides a distorted picture of the economy.
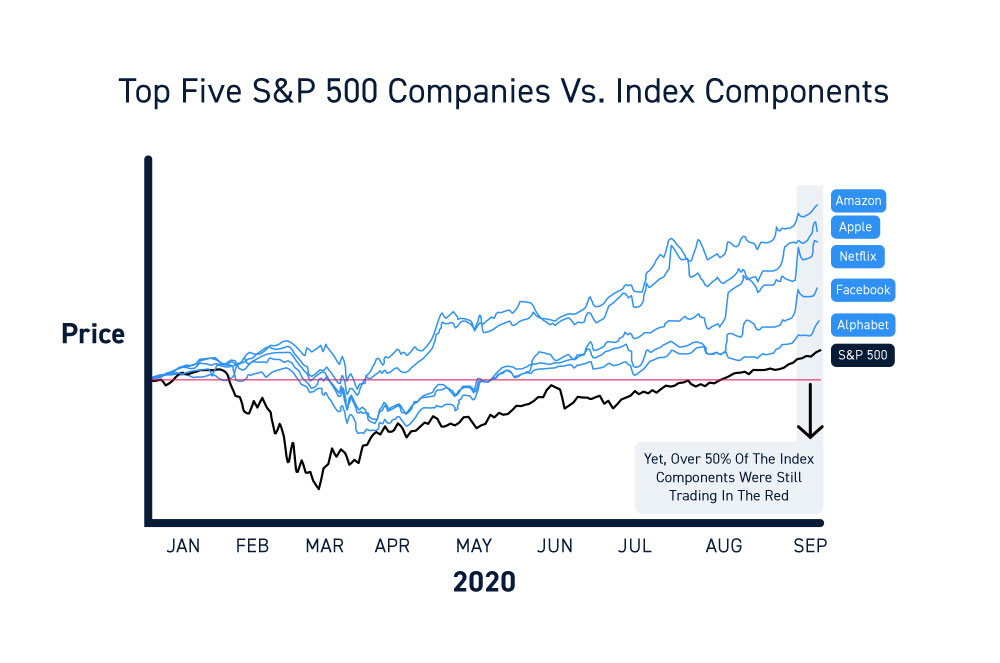
When the S&P 500 rallied to new all-time highs in September 2020 recovering from the novel coronavirus pandemic, the majority of the index gains were created by the concentration of money flow into a small fraction of technology and communication stocks. The top five Companies represented over 20% of the index weight. As a result, over 50% of the index components were still trading in the red for the year. This limited breadth created a distorted view of the actual performance of the full index components.
There Are Only 500 Stocks
The index only represents the performance of 500 to 509 stocks. While this may seem like a large sample size, there are over 6,000 publicly traded U.S. stocks and millions of private companies. It doesn’t represent every business operating in the U.S. Trends that affect industry generals may not flow all the way down the totem pole due to their scale. It’s important not to assume the S&P 500 completely represents the U.S. economy.
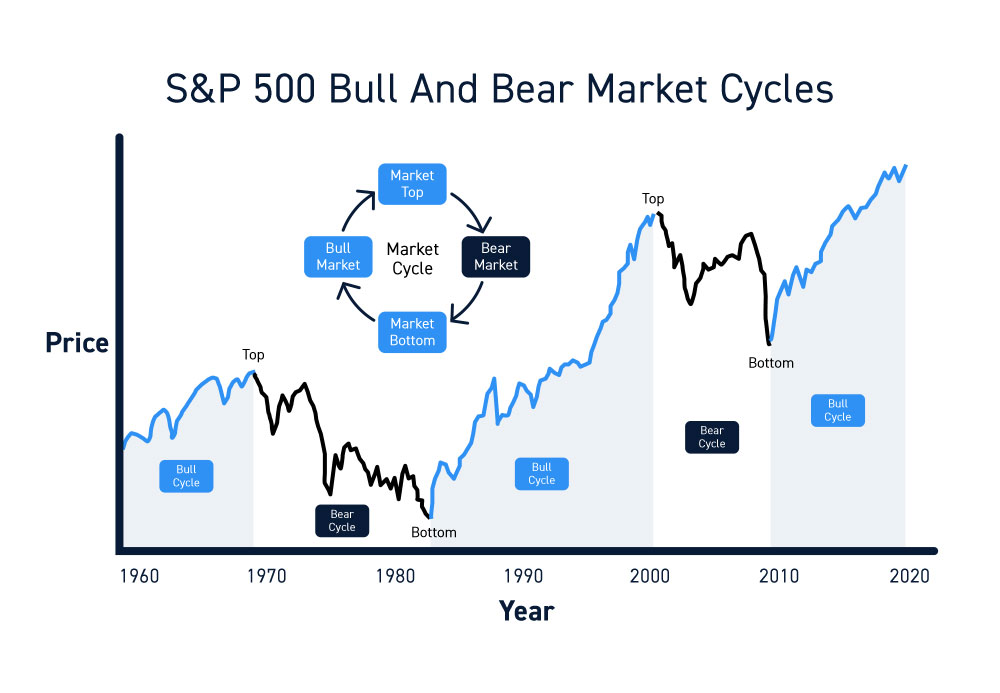
Understand Market Cycles
The S&P 500 performance is relative to market cycles. While bull market cycles vastly outperform bear market cycles, they can be very painful as the index can plunge 20% to over 50% during these periods. Not all Companies recovery or survive from bear markets and new companies can emerge as leaders. Every bear market is accompanied with the looming question of whether this time is “different” as fears of an economic recession can stoke waves of fear-based panic selling.
How to Trade the S&P 500
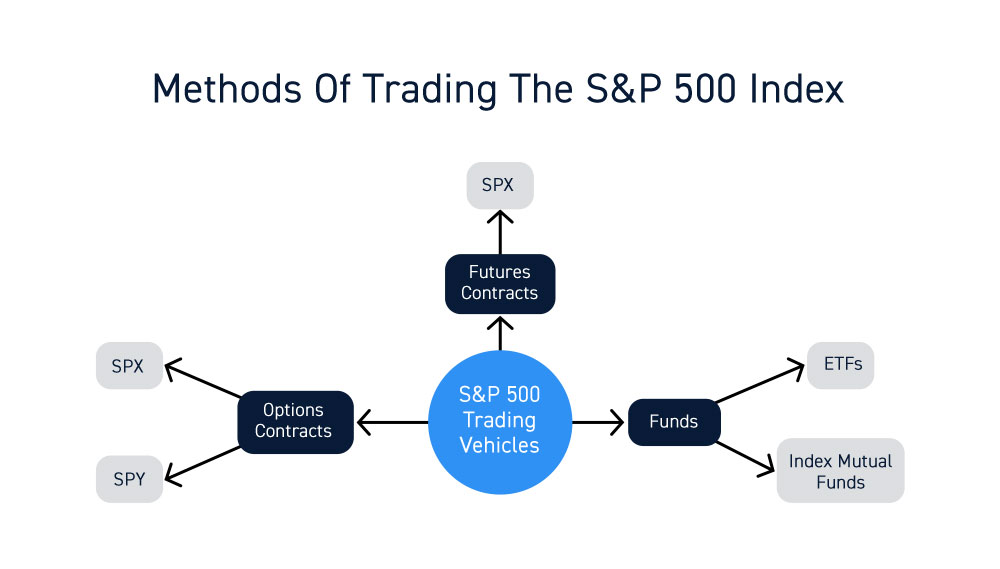
The S&P 500 index can be traded through many different vehicles. The S&P 500 futures contracts are the most liquid and heavily traded futures contracts in the world. Numerous funds and traders use them to hedge their portfolios.
Passive investors that want to set-it and forget-it can partake in the S&P 500 performance through index exchange-traded-funds (ETFs) or index mutual funds. ETFs have less fees and enable intraday executions when entering or exiting positions as opposed to mutual funds which execute the following day. Directional and hedge players can utilize various options strategies on the SPY ETF or SPX contracts. The SPY ETF is accessible during market and after-hours providing access to liquidity when needed.
Understand the Factors that Influence the S&P 500
The S&P 500 index is directly influenced by the S&P 500 futures and movements of its component stocks. There is systemic impact when larger economic, social and geopolitical events occur. The U.S. Federal Reserve actions and statements also impact the S&P 500 especially during binary events like a schedule rate decision and press conference. Economic reports also impact the market sentiment which moves the index, like the U.S. unemployment and jobs report, Chicago Purchasing Managers report and Michigan Sentiment report to name a few.
Be Cautious with Leverage
Using margin on ETFs, stock and options is always risky and large price gaps up and down are common. Leverage is a double-edged sword. This is especially critical when trading the S&P 500 e-minis contracts, which utilize margin leverage on trades. Numerous traders have blown out being on the wrong side of a gap or grind in the e-minis, so always practice prudent trade management including prompt stops. It’s imperative to stay nimble during volatile trading markets and avoid taking overnight positions as a key component of risk management.


