

Thanks to after-hours trading and pre-market catalysts, it’s not uncommon for stocks to open at a significantly different price than the price at which they closed the afternoon before. These pre-market gappers offer many opportunities for traders in the first hours after the market opens.
In this guide, we’ll explain everything you need to know about pre-market gappers, including how to find them and how to trade them.
What is a Pre-market Gapper?
A pre-market gapper is any stock that opens the trading day at a different price than the price at which it closed the prior day. Stocks can gap up or down – that is, their opening price can be higher or lower than their previous closing price.
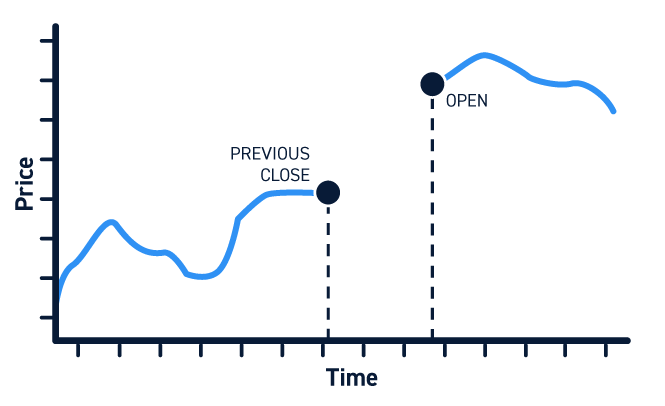
There is no minimum price difference between close and open required for a stock to be considered a pre-market gapper. However, large gaps of 1% or more typically present the most trading opportunities.
What is the Significance of a Pre-market Gapper?
Pre-market gappers are typically stocks around which there was significant news after market close. That news could be an earnings reports, a major corporate announcement, or a political or economic event that impacts a company’s share price. These events are likely to drive trading in a stock throughout the next day and could be a catalyst for a larger price movement than the one that starts during after-hours trading.
More broadly, pre-market gaps are an indication of volatility. If a stock is experiencing a large change in price between close and open, it’s likely that volatility will remain high once the market opens. This above-average volatility may offer setups for trading, although it’s important to keep in mind that pre-market gaps aren’t always accompanied by high trading volume.
How to Find Pre-market Gappers?
The easiest way to find pre-market gappers is to use a stock scanner. Simply search for stocks for which the current day’s opening price is greater or less than the previous day’s closing price. You can further refine your search by adding filters for the magnitude of the price gap. Filtering for stocks with a gap of at least 1% is a good way to start scanning for pre-market gappers.

You can also narrow your search by filtering on trading volume. Look for stocks that are experiencing trading volume greater than their 10-day average volume. While pre-market gappers have high volatility, the combination of high volatility and higher than average volume is typically best for trading.
How to Trade Pre-market Gappers?
There are several things to consider when trading pre-market gappers.
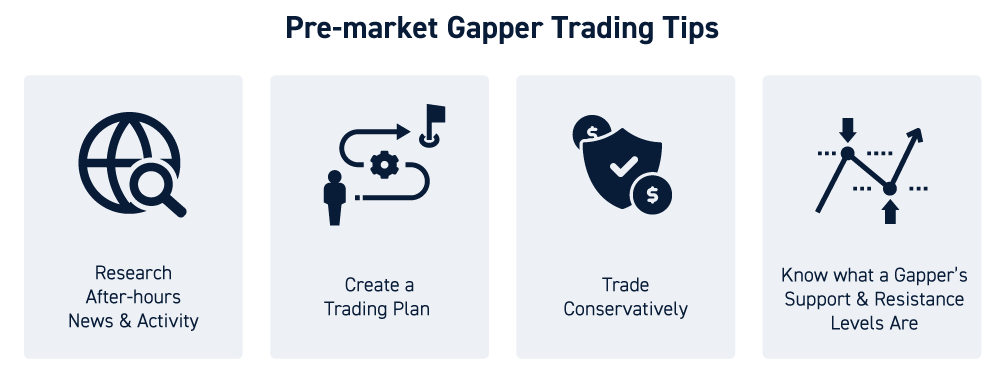
First, it’s important to understand what’s driving the after-hours activity. After-hours trading volume is low, so relatively small pieces of news can have an outsized impact on a stock’s opening price that won’t be sustained during regular trading. On the other hand, significant news can be a catalyst for strong momentum and above-average trading activity. The better you understand what’s driving a pre-market gapper, the better you can approach the stock during regular trading.
You should also be aware of a pre-market gapper’s support and resistance levels. A bullish gap up can run into resistance, creating opportunities to trade a reversal or a breakout. Likewise, a bearish gap down can hit a support level and reverse or break down.
As for any type of trade, you should create a trading plan for how you want to approach a pre-market gapper. Set out stop loss and profit targets, and have a clear plan in place for how you plan to deal with increased volatility or activity around support and resistance levels.
It’s worth being extra cautious around pre-market gappers because of their high volatility. Since these stocks are typically responding to overnight news, trading activity can be rapid and seesawing as traders try to interpret the news. Trading conservatively may be prudent, especially in the first hour after the market opens.
Conclusion
Pre-market gappers are stocks that open higher or lower than they closed the day before. These gaps are often caused by after-hours news and events, and they can signal higher volatility to come throughout the current trading day.
Pre-market gappers offer many opportunities for aggressive traders, but it’s important to understand the catalyst driving a stock, be aware of support and resistance levels, and carefully manage high volatility. You can find pre-market gappers using a stock scanner.


