

When a Company releases its earnings report, the stock price will react with elevated volume and volatility often resulting in a price gap up or down the following day. Traders look forward to the earnings season where larger stock price moves can present outsized opportunities for nimble traders.
What Are a Company’s Earnings
A Company’s earnings release is an SEC required filing of a Form 10-Q disclosing its financial performance for the prior quarter. Companies will usually provide a press release and follow up conference call providing further insights and potentially forward guidance. The earnings release is akin to a report card that the market judges by the movement of the underlying stock price.
Types of Earnings Reports
Earnings are released each quarter, composed of three calendar months. There are four quarters to a full year. The fourth quarter earnings release is often combined with the annual report which provides the full-year review detailing the corporate strategy and business operations moving forward.The annual report is filed with a Form 10-K.
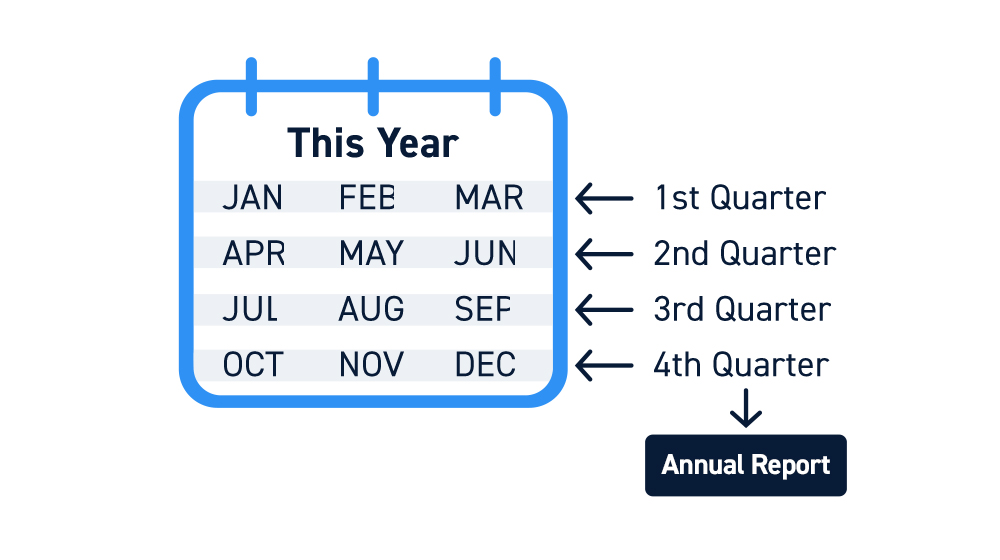
While there are four quarters, they may not correlate with the regular calendar. Some companies will have their fiscal year end earlier than the calendar year therefore resulting in the “fiscal” first quarter reflected as the quarter ending in September, instead of December. This can be distinguished by noting which ending month the report includes. For example, a Q1 Fiscal 2021 earnings report for the quarter ending in October 2020 indicates a different fiscal calendar period.
The Significance of Earnings Reports
Earnings reports disclose a Company’s financial performance and growth which is core to fundamental research. Investors are encouraged to research the fundamentals of their stocks, especially long-term investments.
For traders, earnings reports provide a binary event catalyst that generates heavy volume and volatility for the underlying shares. Exceptionally strong or weak performance can result in a stock price gap up or down. This draws in more participants generating swift price moves that can be traded for quick profits, but also quick losses as the sword cuts both ways. It’s important not to impulse trade earnings reactions as the stock behavior can change dramatically and act “abnormal” for a period of days.
How to Analyze an Earnings Report
Earnings reports contain a ton of financial information that can be quite overwhelming for non-professionals. Additionally, the numbers may not always appear as they seem depending on which metrics and accounting is used. You can expect Companies to try their best to “spin” every earnings report in a positive light in the interest of improving shareholder value. Here are the basic key financial metrics to watch for:
Revenue
Revenues are the sales generated in the quarter. This is also referred to as the “top line” (IE: “top line growth was 10% year-over-year”). Keep in mind that publicly traded companies are generally required to use accrual-based accounting, which means that revenues can be posted when customers are invoiced for products delivered and services performed, not necessarily at the time of collection. This is to give investors the timeliest insight into a Company’s business operations.
Profit
Profit, also referred to as the bottom line, represents how much money a company made after subtracting expenses from revenues. There are three types of profit descriptions.
Gross profit is calculated by subtracting the cost of goods (direct labor and materials used to generate the product) sold from revenues and excludes fixed expenses like rent and salaries.
Operating profit, also referred to as earnings-before-interest-depreciation-amortization-and taxes (EBITDA), includes the additional expenses to operate as a business including rent, utilities and salaries, excluding tax and interest paid on debt or investment income.
The net profit is the excess money left over after subtracting all expenses from revenues, excluding taxes and interest payment. If expenses are greater than revenues, then a loss is created.
Businesses obviously need to generate profits to grow and remain solvent. However, in public markets, basic economic principles can be adjusted to turn a loss into a profit depending on what is included or excluded as an expense. This “lens” is often referred to as financial engineering. It’s important to understand and read the fine print in the 10-Q reports to determine what is actually included in determining the earnings-per-share (EPS).
GAAP and non-GAAP
Generally accepted accounting principles (GAAP) is the form of accounting that factors every form of compensation as an expense. This means an employee that is paid $50,000 salary and awarded $10,000 in stock is posted as receiving $60,000 in annual compensation even if the stock is restricted.
Companies see this as restrictive, not painting an accurate picture of the underlying business since stock is a non-cash award. Therefore, Companies will often release a non-GAAP version of their earnings which don’t include non-cash items like stock-based compensation. This results in “better” looking performance numbers as expenses appear less thereby bolstering profits.
Analysts will also use the non-GAAP numbers when deriving forecasts and earnings estimates.
Earnings Per Share
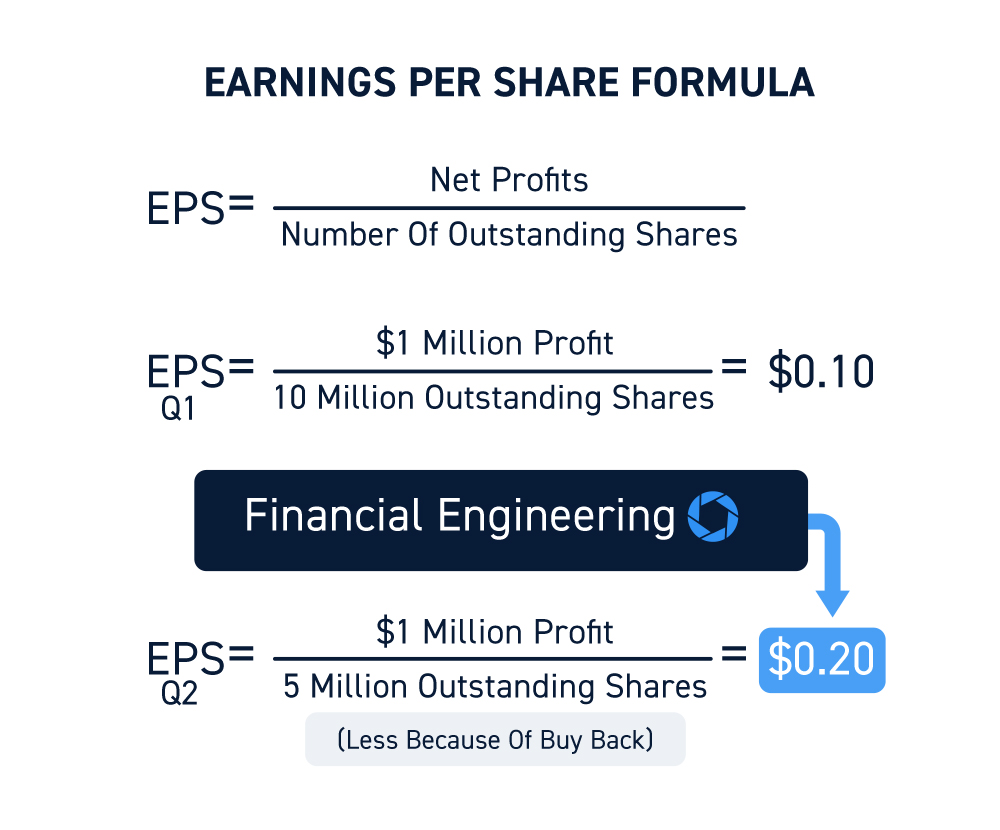
The earnings per share (EPS) is the most common financial metric used by analysts and investors to determine performance at a glance. This is derived by dividing the net profits by the number of outstanding shares (IE: $0.23 EPS). However, financial engineering can take place by decreasing the number of outstanding shares through stock buyback programs.
As the Company purchases its own shares from the market, the supply dwindles thereby inflating the EPS for the same result. For example, a Company that makes a $1 million profit on 10 million outstanding shares has an EPS of $0.10. If the Company buys back 5 million shares the next quarter, it shrinks its outstanding shares to 5 million. If the Company makes $1 million in profits again, the EPS doubles to $0.20 and implies a 100% earnings improvement when in reality the earnings were flat.
Cash Flow
The cash flow indicates the net flow of cash in and out of a business. As they say, cash is the lifeblood of business. Not to be confused with profit, cash flow underscores the Company’s ability to generate the cash to remain solvent and generate growth.
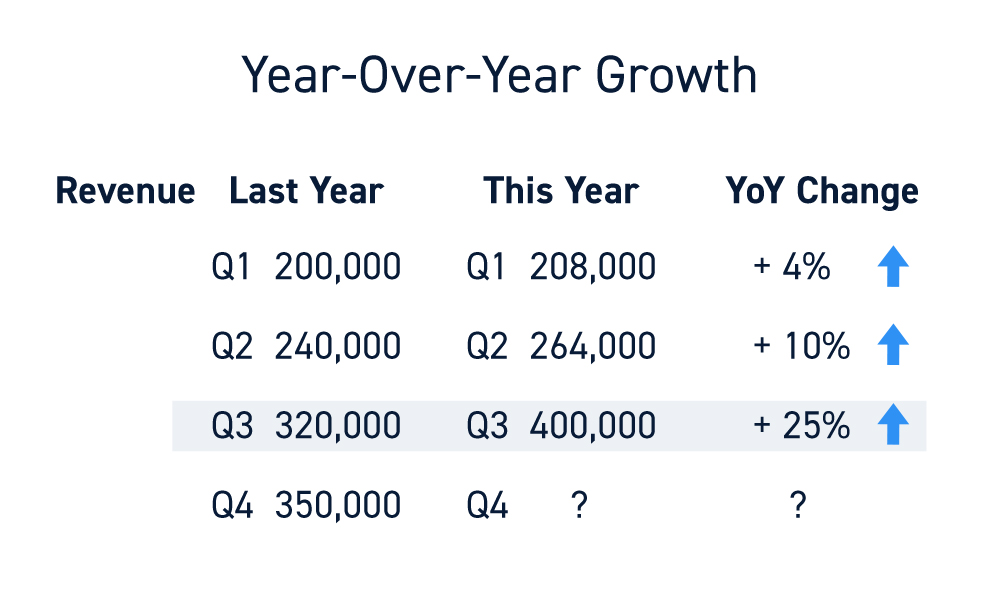
Year-over-Year Growth
The term year-over-year (YoY) refers to the percentage growth or decline for the same quarter in the prior year. For example, a Company reporting 25% YoY revenue growth for Q3 means the revenues improved by 25% over the same three-month period in the previous year. YoY comparisons are used to determine how well a Company is growing or declining in terms of top and bottom line performance.
Analyst Estimates
Publicly traded stocks usually have analyst coverage which means an analyst is assigned to monitor and research the Company performance. The more widely traded stocks tend to have more analysts following/covering its performance.
Analysts will hypothesize upcoming estimates in terms of top and bottom line performance. The consensus analyst estimates are the average of the predictions by all or most of the analysts covering a stock. This estimate becomes the benchmark for performance.
If a Company beats the analyst estimates dramatically, it can cause a price gap up or buying momentum. Vice versa, if a Company misses analyst estimates, it can cause a price gap down or selling pressure. Usually Companies will provide forecast estimates that analysts will adopt and tweak in accordance with their own research methods.
Guidance
Companies can shape their own narrative by providing forecasts or guidance for upcoming quarters. If a Company raises guidance, it can have a positive effect on the underlying share prices and vice versa if a Company lowers its guidance. Since markets are forward thinking, the forward guidance often times trumps the earnings results. It’s possible for a Company to miss the analyst estimates but raise its guidance and cause share prices to rally higher. The opposite situation where a Company beats the analyst estimates but issues lower guidance can plummet share prices.
Earnings Calls
Quarterly earnings releases are usually accompanied by an earnings conference call either immediately following the release or the next day. The earnings conference call can provide deeper insights into the performance by providing highlights of the current quarter, forward guidance and addressing questions directly from analysts and investors. Earnings calls can have a direct material impact on stock prices.
Deriving Insights Outside the Numbers
The earnings press release may not convey the whole story for the quarter. The numbers are just summarizations of the metrics, but the nuances and underlying trends of the operations may be more subtle. By listening to the conference call transcripts especially the question and answering (Q&A) sessions, subtle clues like stagnant or slumping sales in a division, large partnership, future investments, headwinds and tailwinds may be revealed.
Common Errors When Analyzing Earnings
When analyzing earnings results, it’s important to avoid common errors.
If a Company beats its EPS estimates, but the stock drops, then the market may be focusing on lowered forward guidance or discounting one-time events like a sale of a division. It may be a case of financial engineering that shows EPS growth YoY, but that’s due to a smaller number of outstanding shares due to buybacks.
Compare the net profit/income YoY to get a better indication of actual growth or financial engineering. The same applies on share prices that spike on seemingly weak earnings. The Company may have raised its top and bottom line guidance for the next quarter or hinted at a big contract win in the conference call.
How to Trade Earnings
Predicting a Company’s earnings results are a coin toss at best. The actual financial results are anyone’s guess. Even trickier is predicting the reaction to the actual earnings report.
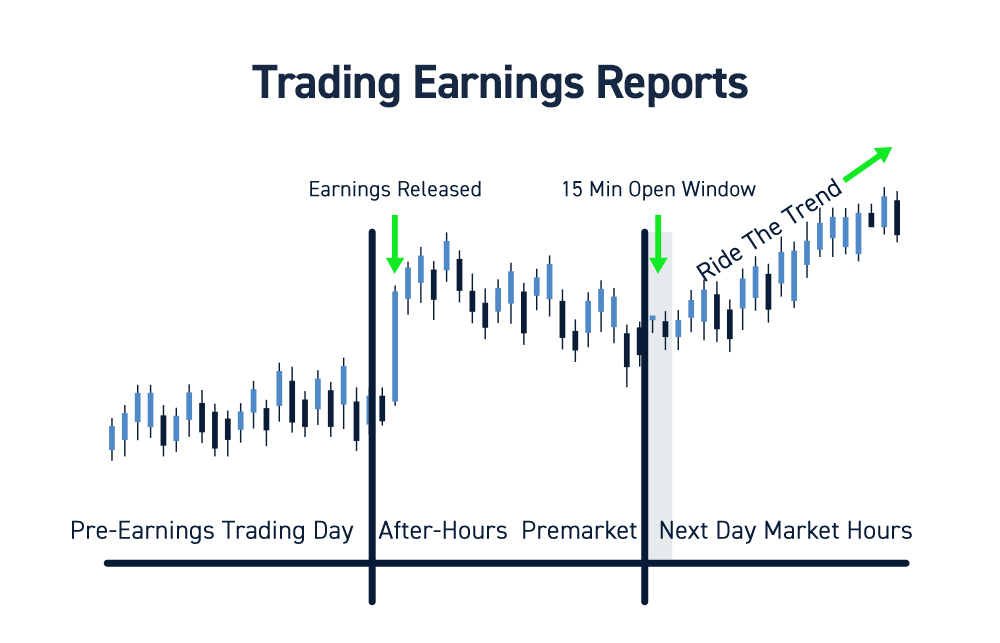
The key to trading earnings is not to make a fool’s bet by taking a position into the earnings release, but to trade the reaction after the release. Price moves will be sped up dramatically especially in the after-hours. It’s prudent to only consider trading during market hours when there is the most liquidity.
It’s also wise to give the open some time for the impulse reactions to settle down and a trend to emerge, usually 15-minutes or more after the open. For those nimble traders who insist on trading earnings, here’s a few tips:
Use Smaller Sizes and Keep Tight Stops
Risk is based on exposure, which equates to position size and holding period. By using much smaller sizes, you can trim the risk inherent with the volatility that accompanies an earnings reaction. Keep your holding time to a minimum and don’t hold just to get back to even. Discipline is critical and cutting losses quickly is the key to survival. Earnings reactions tend to start with impulse moves in both directions before a trend emerges. If playing reversions, gauge the most viable or extreme envelope ranges to scale small size into for quick profits. Most importantly, have a stop-loss set and ready to execute if your premises crumble. Remember that stops are just a pause in your trading to buy time. Don’t be wrong for too long.
Don’t Underestimate a Move
The ultimate gauge of a Company’s earnings performance is the price action of its underlying stock. Don’t try to justify the irrationality of a price move because the market is always right. A Company may blow out the estimates and raise guidance, yet the stock can still collapse from a sell-the-news reaction. This means the upside was already priced in and selling off after the news is out. Again, don’t be wrong for too long. Don’t predict or rationalize, just react.
Hedge in Advance
If you are a long-term holder of a stock, its always prudent to hedge your position into the earnings report. This can be done through various options strategies with the simplest being taking put options.
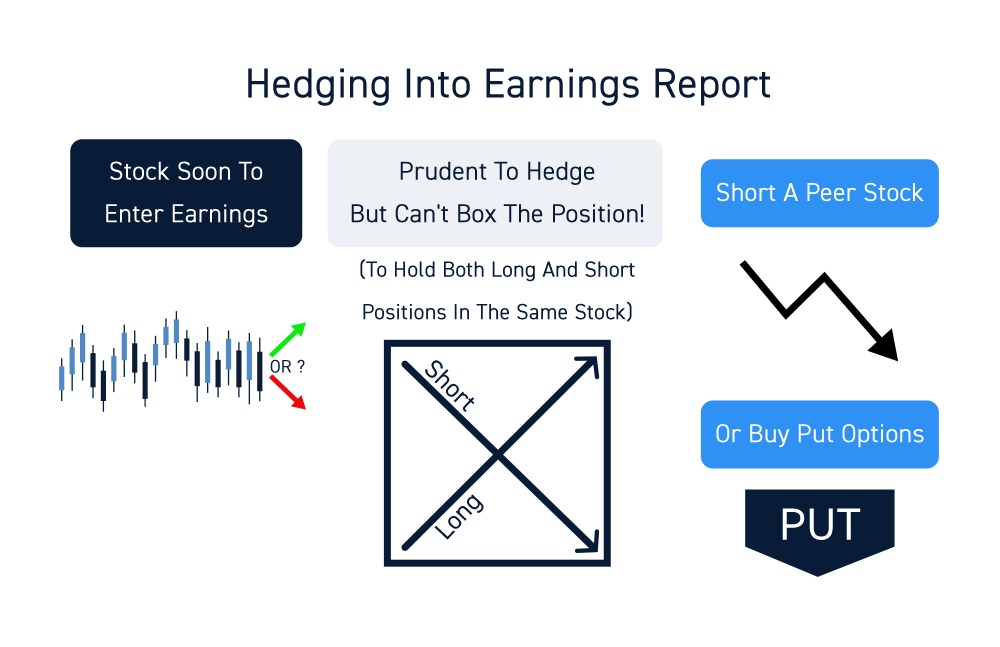
Make sure you are aware of peer stocks that trade with negative or positive correlation that can be traded as a semi-hedge. Outside of boxing your position (which most brokers won’t allow), a perfect hedge is literally impossible. Earnings season is the Super Bowl of trading that occurs four times a year. The key is to establish familiarity with how stocks behave normally and on the earnings reaction. Familiarity breeds confidence and helps you maintain agility.


