

Earnings reports provide important updates to investors about how a company is doing financially and what the company’s management expects the near future to look like. Earnings reports are often the catalyst for significant movements in a company’s stock price as investors react to the financial update.
In this guide, we’ll explain how to read an earnings report and what earnings details that you may want to keep your eye on.
What is an Earnings Report?
An earnings report is a regulatory filing that publicly traded companies are required to make once per quarter and once per year to update shareholders on their financial performance. Earnings reports include details about a company’s revenue, profits, expenses, and much more over the past quarter of operations.
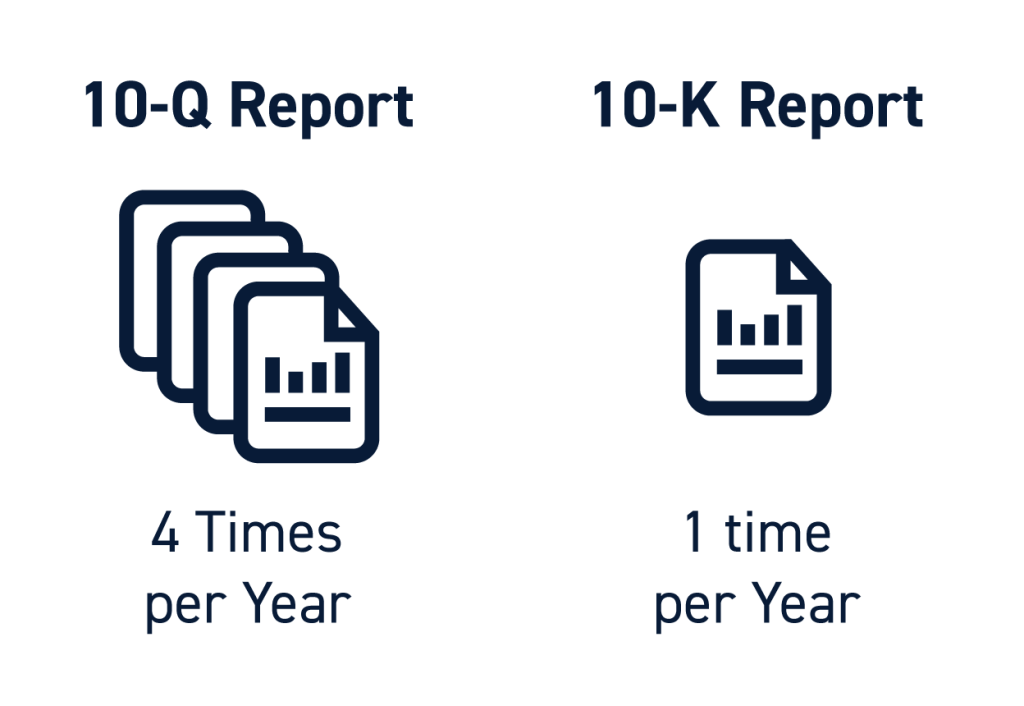
Earnings reports can be comprehensive affairs that often include a summary by company executives, a call with shareholders, and interviews with financial media outlets. However, the meat of an earnings report – and what is required by the SEC – are 10-Q and 10-K filings.
The 10-Q form is designed for quarterly earnings reports and must be filed within 35 days of the end of a company’s fiscal quarter. The 10-K form is designed for annual earnings reports and must be filed within 60 days of the end of a company’s fiscal year. Financial statements included in quarterly earnings reports do not need to be audited, but those included in annual earnings reports do.
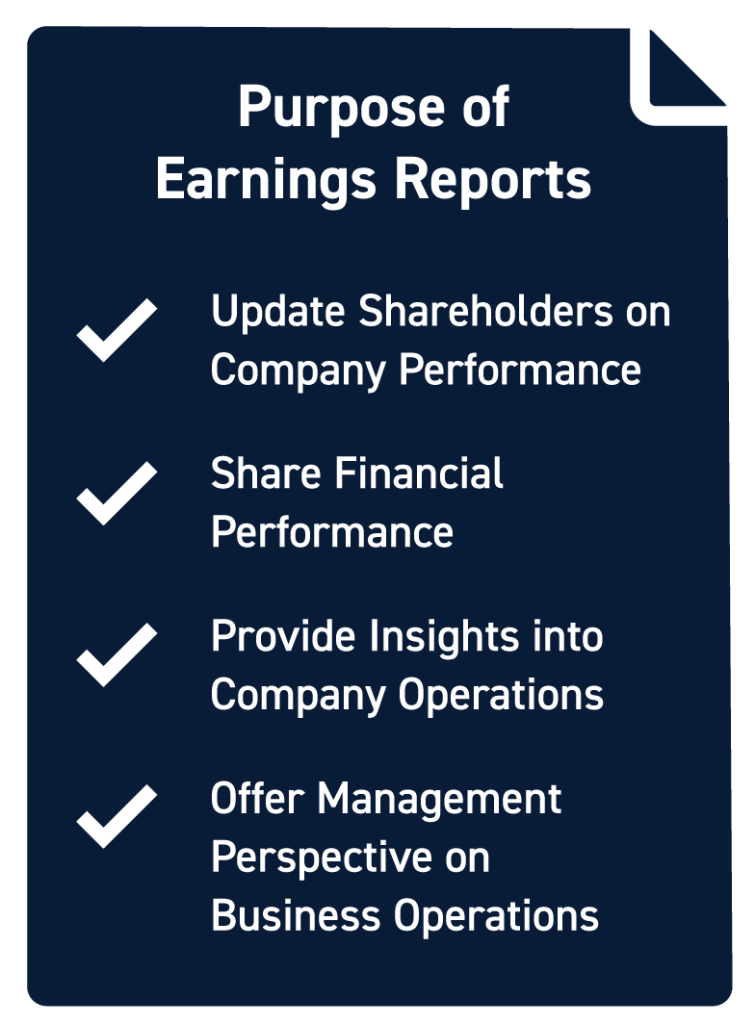
The Purpose of Earnings Reports
The main purpose of earnings reports is to provide an update to shareholders on how a company is performing financially. These reports include a breakdown of revenue, expenses, and profits, as well as details about sales, cash flow, debt, and more.
Earnings reports also include a comparison to data from the previous quarter or year. This enables investors to monitor changes in a company’s performance over time, such as increased sales or reduced debt. The data included in earnings reports is the basis for most fundamental analysis.
In addition, earnings reports serve to provide information about where a company currently stands. It identifies the company’s areas of strength and growth, as well as risks that could potentially hurt the company’s performance in the future.
Components of an Earnings Report
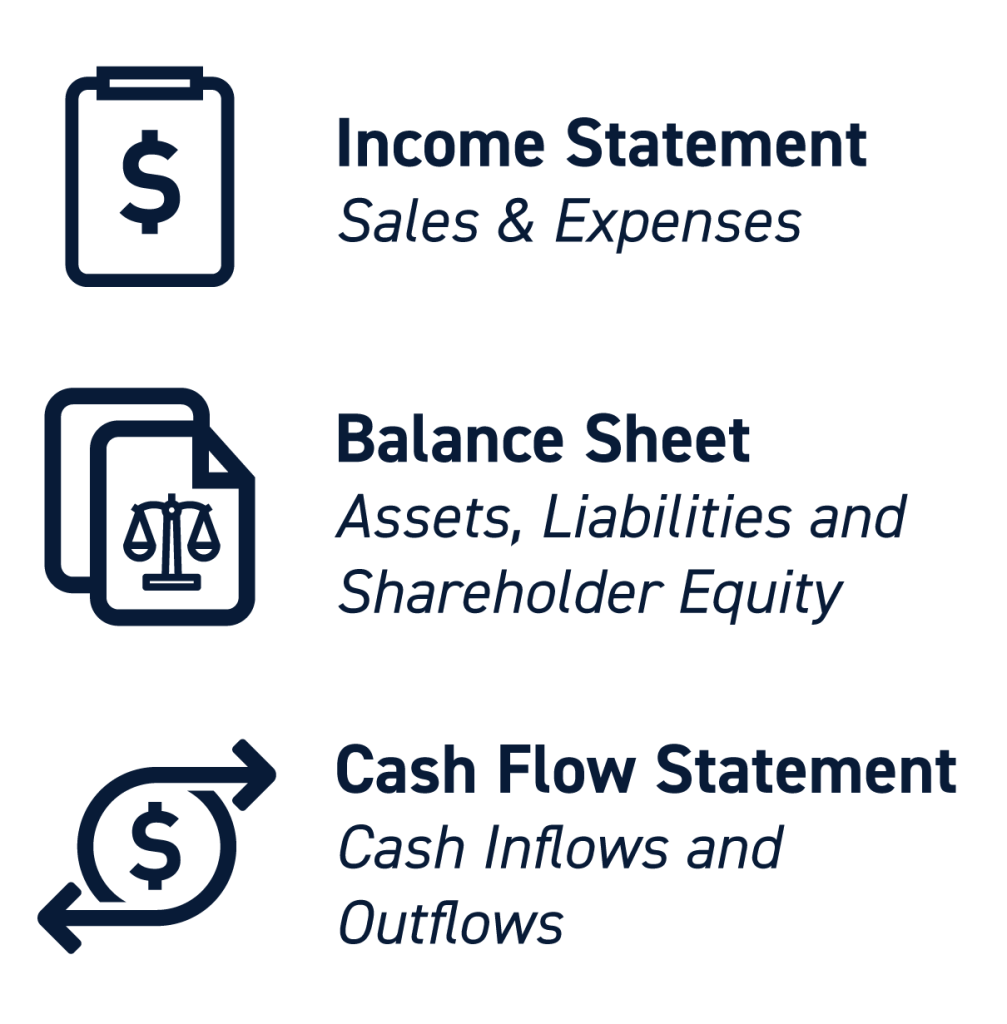
An earnings report consists of four distinct components:
- Income statement
- Balance sheet
- Cash flow statement
- Management discussion
How to Read an Income Statement
The income statement provides a summary of a company’s performance over a defined time period – three months for a quarterly earnings report or one year for an annual earnings report. This is where a company reports revenues, expenses, profits, and losses. This is where investors will find a company’s earnings per share, which is based on net profit.

There are a few key line items to keep an eye on in the income statement:
- Sales. At most companies, sales are the main income driver. Sales data can provide information about whether a company’s sales are growing or shrinking over time.
- Profit margin. This indicates how much of each dollar in revenue ends up as net profit. Increasing profit margins are often a sign of higher efficiency within a company.
- Expenses. Expenses are subtracted from sales and other income to calculate a company’s profit. A company’s profit can decrease even if revenue increases if expenses increase by a greater degree.
The income statement offers a summary of business operations and answers two important questions:
- How much is the company making?
- How much is the company spending?
How to Read a Balance Sheet
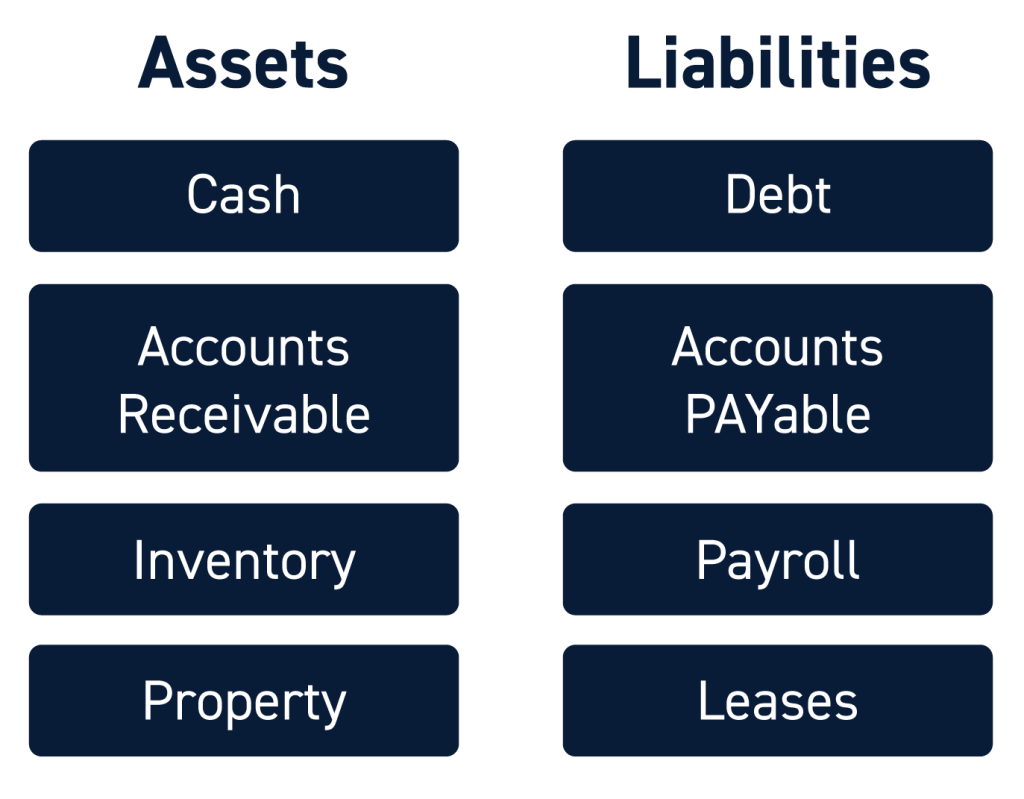
The balance sheet provides an overview of a company’s assets and liabilities at a given point in time. This includes company property, cash, debts, and shareholder equity. Whereas the income statement covers a set period of time, the balance sheet is better thought of as a snapshot taken on a specific date.
The balance sheet is important because it provides the basis for many fundamental analysis metrics and provides details about how a company’s capital is structured. It offers investors key information about a company’s financial standing and health.
Some of the most important line items in the balance sheet include:
- Debt. Companies must report all debt on their balance sheet, including both short-term and long-term debt obligations. Money that companies owe to vendors or employees on a short-term basis may be reported as accounts payable rather than debt.
- Cash and cash equivalents. This line item offers an accounting of how much cash a company has on hand to pay debts or reinvest in the company. If a company is running low on cash, that can be a sign of financial distress.
- Capital assets. The balance sheet lists the value of all capital assets a company owns, such as property, manufacturing equipment, vehicles, and more. In some industries, companies also include the value of their intellectual property.
How assets and liabilities are reported on a balance sheet can vary widely between industries. So, it’s worth comparing a company’s balance sheet to its peers.
How to Read a Cash Flow Statement
The cash flow statement provides a more detailed look at how cash is moving into and out of a company. While it might seem like a cash flow statement should be identical to an income statement, this is often not the case. Companies may book revenue on a sale, but not receive payment until later. In that case, the sale will appear in the company’s income statement, but not in its cash flow statement. So, the cash flow statement is important for understanding how a company manages its capital.
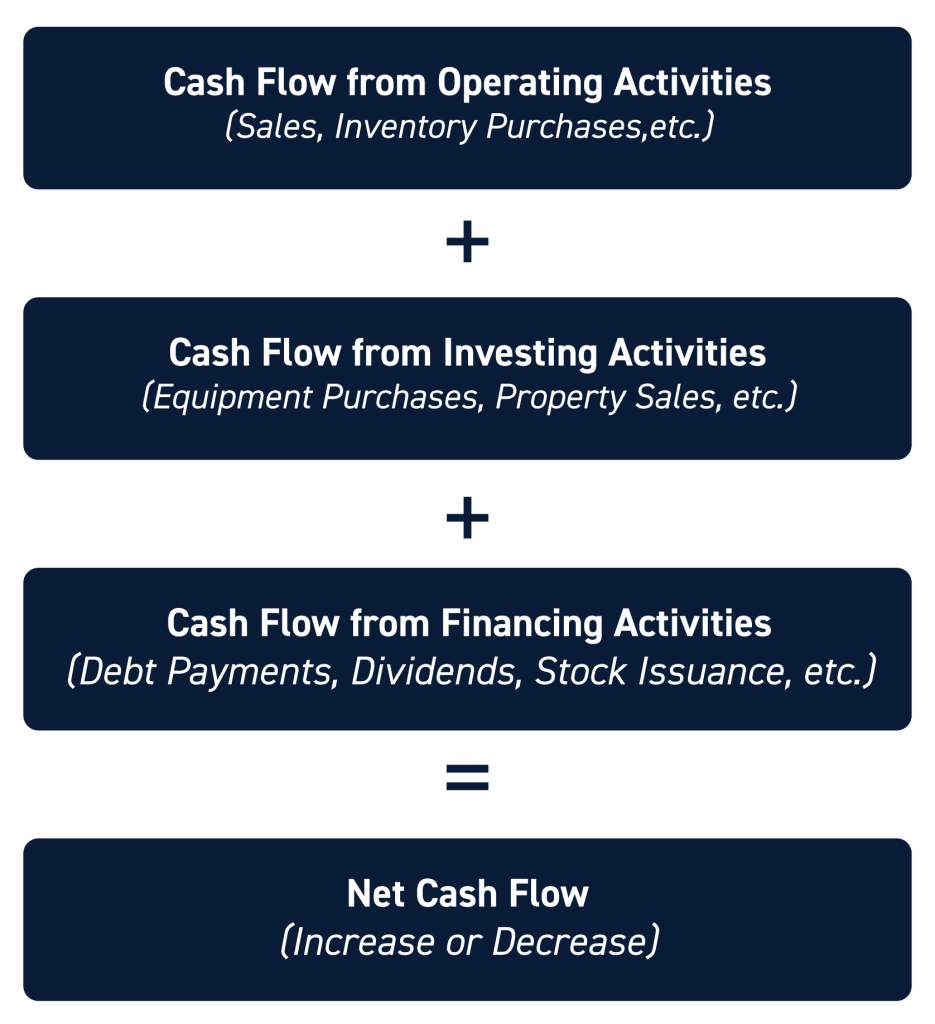
Cash flow statements are typically broken down into three sections:
- Cash from operations. This includes all cash inflows and outflows due to operations, which includes sales and expenses that are paid during the statement period. For profitable companies, the majority of positive cash flow is typically cash from operations.
- Cash from investing. Cash from investing is typically dominated by cash outflows (expenditures) due to the company investing in its business. This category includes capital expenditures, which are cash outflows related to a company purchasing new property or capital equipment.
- Cash from financing. Cash from financing includes cash received from or paid to creditors. Companies may have high cash inflows from financing when they are borrowing money and high cash outflows due to financing when they are paying off debt.
The sum of cash from operations, investing, and financing is a company’s net cash flow. This is the net amount of cash that a company gained or lost during the statement period.
Management Discussion
The management discussion is important part of any earnings report because it provides insights from a company’s executive team. Typically, the management discussion includes an explanation of any trends or irregularities found in the income statement, balance sheet, or cash flow statement.
This discussion can also highlight a company’s areas of growth or weakness and provide guidance for the upcoming quarter or year. So, the management discussion is forward-looking whereas the rest of the earnings report is focused exclusively on what has already happened.
Conclusion
Earnings reports are one of the main ways that investors can get updates about a company’s financial performance and play an important role in fundamental analysis. Earnings reports must be filed once per quarter and once per year. They include an income statement, balance sheet, cash flow statement, and management discussion. Investors should understand how to approach these reports and what to look for in order to properly gauge a company’s value.


