

A bull trap is a price movement that lures bullish investors into thinking that the price of a stock is about to rise. In reality, any upward movement is short-lived and quickly overtaken by bearish activity, causing traders who bought into the bull trap to lose money.
In this guide, we’ll explain what bull traps are and how traders can spot them.
What is a Bull Trap?
A bull trap is an upward price movement that resembles a reversal from a downward trend. Often, bull traps involve an upward bounce off a support level or an upward break through a resistance level. These setups can trick bullish traders into buying a stock on the belief that a sustained upward price movement is just beginning.
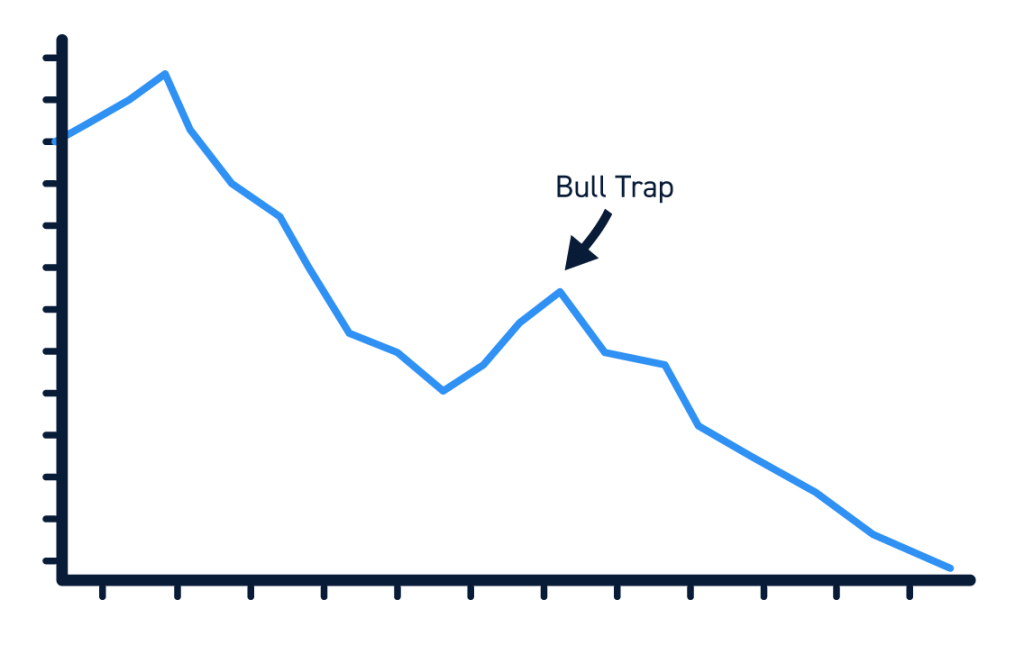
However, a bull trap isn’t a true reversal. The bullish price action that traders bought into is short-lived and the stock resumes its prior downtrend within a few candlesticks. At that point, bulls who bought into the bull trap are likely to take a loss. Bullish traders who still fail to recognize the bull trap and do not exit their position quickly can take much larger losses as the price marches downward.
What Causes a Bull Trap?
Bull traps can be triggered by a variety of different price movements, most of which involve a notable upswing in price action after a strong downtrend. For example, bullish traders can be lured into buying by a “dead cat bounce” in which the price of a stock temporarily bounces off of a strong support level following a prolonged downtrend. Bullish traders may also be tricked into a bull trap when the price of a stock falls below a support line, then breaks back above it.
Bull traps are most dangerous to aggressive traders who step in to buy shares at the first sign of bullish price action. Often, these traders have a pre-existing bull thesis around a stock and are biased towards buying. This bias can encourage traders to step in quickly, even if an upward price movement is not supported by trading volume or other technical indicators.
How to Spot a Bull Trap
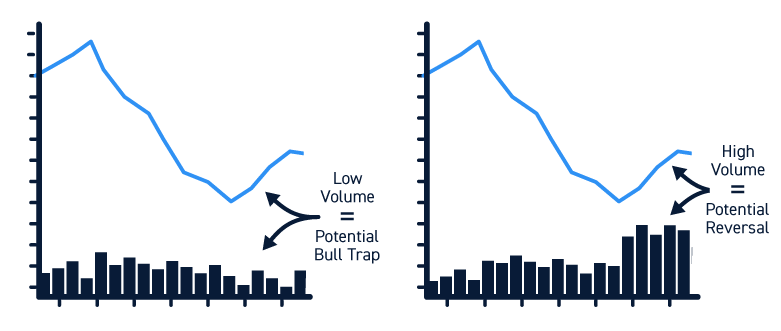
There are several ways to spot a bull trap. Typically, these traps involve price movements around support and resistance lines, but aren’t supported by trading volume or key momentum indicators.
The simplest way to spot a bull trap is to look at trading volume. In a true bullish reversal, the upward movement should be accompanied by above-average trading volume as bulls step in to buy the dip. In a bull trap, this higher trading volume is often missing. The price of a stock may go up, but the lack of trading volume suggests that bulls are not buying in large quantities to support that movement.
Another way to spot a bull trap is to look for divergence between a stock’s price and momentum indicators like MACD and RSI. Divergence occurs when the stock price is moving upward, but MACD and RSI are still trending downward. In a true bullish reversal, the stock price, MACD, and RSI are typically all trending upward at the same time.
You can also use Fibonacci retracements to get more information about support and resistance levels for a stock’s price. In many cases, bull traps will bounce off a visible support level, but will find resistance at a Fibonacci level just above that. You can look for a break above both a support level and Fibonacci level to confirm a reversal.
How to Avoid Getting Caught in a Bull Trap
The best way to avoid getting caught in a bull trap is to be cautious when trading reversals. Bullish traders are often caught in bull traps because they are too aggressive, buying into a position as soon as price action turns bullish instead of waiting for trading volume and or momentum indicators to confirm a reversal. You may miss out on some gains by waiting, but you also significantly reduce the risk of falling into a bull trap and losing money. Once a reversal confirms, you can still enter a position and profit from the majority of the upward price movement.
It’s also important to keep an eye on price action, trading volume, and technical indicators after entering a trade. If trading volume begins to decline, that can be a sign that the bullish price movement is losing support. Inverted hammer and shooting star candlesticks, in which the price rises but then falls and closes near the open, can also indicate that bears are retaking control. Once these signs appear, you should consider exiting your position sooner rather than later to avoid getting caught in a bull trap.
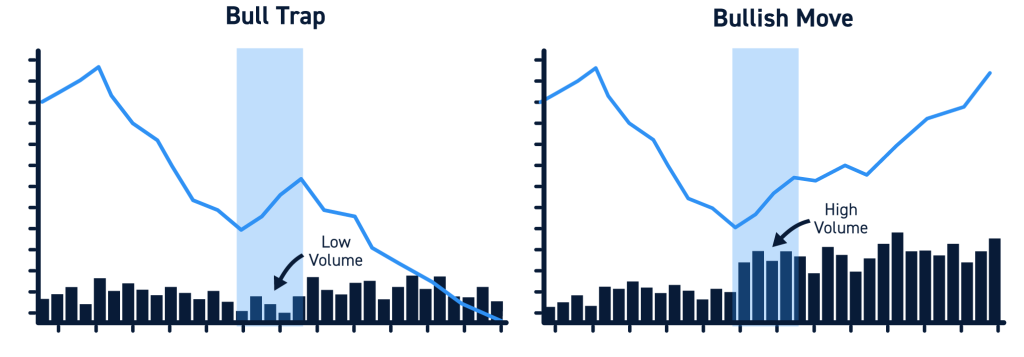
Bull Trap vs. Legitimate Bullish Move
Bull traps closely resemble legitimate bullish reversals at their start, which is part of what makes them so tempting for bullish traders. However, bull traps are short-lived and the prior downtrend resumes after a few candlesticks. Legitimate bullish moves are sustained and may go on for a long time. Legitimate bullish moves may be followed by a period of price consolidation or a bearish reversal.
Legitimate bullish moves are typically supported by high trading volume, momentum indicators, and ongoing price action. If all of these pieces point towards the price moving higher, it’s likely that a bullish move will be sustained.
Bull Traps vs. Bear Traps
Bulls aren’t the only traders who can fall into traps. Bear traps are the inverse of bull traps and can trick bearish traders into short-selling a stock when the price falls temporarily. Like bull traps, bear traps often involve low trading volume and divergence between a stock’s price and momentum indicators.
Conclusion
Bull traps occur when bullish traders are lured into buying a stock when the price rises after a downtrend, only to have that downtrend continue immediately afterwards. You can spot bull traps by looking at trading volume and momentum indicators, as well as by continuing to monitor price action after the initial upward movement. Bull traps typically involve low trading volume and divergence between the stock price and indicators like MACD and RSI, whereas legitimate bullish reversals are accompanied by high volume and directional agreement between the price and momentum indicators.


