

Bear traps are price movements that can trick an unwary trader into losing money. They tempt short sellers to bet that the price of a stock will go down, when in reality it is going up. In this guide, we‘ll explain what bear traps are and how you can avoid getting caught in one.
What is a Bear Trap?
A bear trap is a price movement that tricks bearish investors into take a short position against a stock at the worst possible time.
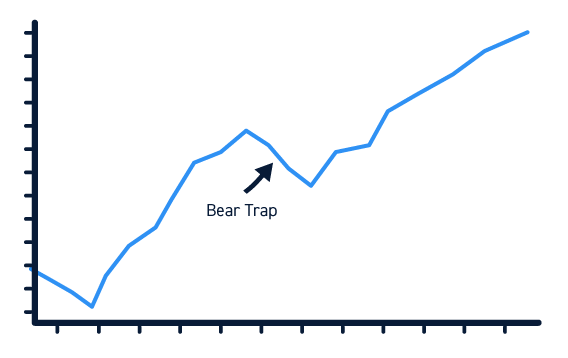
Typically, bear traps occur after a rapid price increase in a stock. Price action makes it look like the stock is about to reverse and give up its recent gains, causing bearish traders to step in and short sell the stock. However, the bearish price movement is short-lived and the stock continues its upward movement. These short sellers are then faced with the choice to close their trade for a certain loss or stay in the trade with open risk and unknown risk reward potential.
A bear trap can also apply to traders who hold a long stock position but are tricked by the short-lived downward price movement into selling. These traders may miss out on additional profits from the continued upward movement but can still realize profits they earned before the bear trap.
What Causes a Bear Trap?
Bear traps are typically caused by a short-lived drop in the price of a stock after a strong uptrend. Short sellers are likely to see this drop as the start of a reversal, especially if the price falls below a key support level.
If the price drop is short-lived and the stock price crosses back above its support level, short sellers are left with losing positions. They also face the prospect of losing even more money if the stock continues its prior upward movement.
More broadly, bear traps are caused by bearish investors being aggressive with their short positions. Often, short sellers get caught in bear traps because they short sell a stock as soon as it drops below a support level, even if other technical indicators have not yet confirmed a reversal.
Short sellers may also be eager to short sell a stock if they believe strongly that a company is overvalued or overhyped. For example, many traders have shorted Tesla stock at bearish pieces of news because they believed – even before the news – that the stock was poised for a crash. This left them vulnerable when the stock was able to shrug off the news and continue moving higher.
How to Spot a Bear Trap
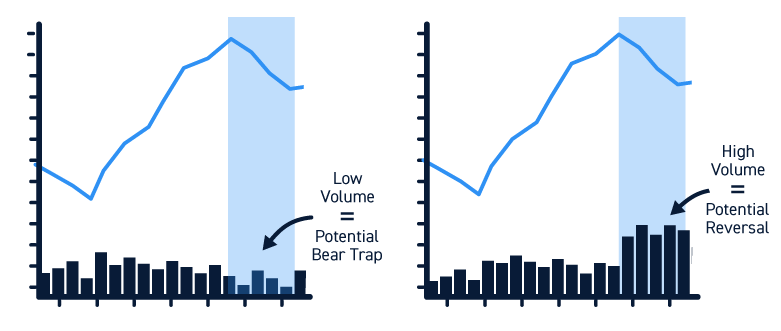
One of the best ways to spot a bear trap is to look at trading volume. True reversals are almost always accompanied by high trading volume, whereas short-lived reversals – bear traps – often involve low trading volume. If a strong uptrend seems to fizzle out or break down below a support level on low trading volume, it should be considered highly suspicious.
Traders can also use a variety of technical indicators to distinguish a true reversal from a bear trap. In particular, momentum indicators like MACD and RSI should be moving downward with the stock price during a true bearish reversal. If MACD and RSI are moving upward while the price is moving downward, this is called a divergence. Divergences are another sign that the price movement may be a bear trap.
Finally, it’s a good idea to check whether a downward price movement is breaking through Fibonacci levels in addition to support levels. Often, a bear trap will find support at a Fibonacci level rather than break through it.
How to Avoid Getting Caught in a Bear Trap
The simplest way to avoid getting caught in a bear trap is to avoid shorting a stock in a primary uptrend before it has confirmed a reversal. That said, there are several measures you can take to protect yourself from bear traps while still retaining the option to open short positions.
First, treat every reversal as if it could be a bear trap. Instead of opening a position at the first sign of a trend breakdown or support level break, see what trading volume, indicators, and Fibonacci levels indicate about the strength of that downward movement. If they suggest the price movement may be a bear trap, wait for more information before trading.
If you do open a short position, it’s important to continue paying attention to price action. If a hammer candle forms, for example, that indicates that buyers are stepping in at the lower prices and that the reversal could be rejected. If trading volume declines, that could be a sign that the reversal will be short-lived. You should also keep an eye on momentum indicators to ensure they continue pointing downward along with the price.
If a short position shows signs of being a bear trap rather than a true reversal, consider closing your position quickly. It’s relatively easy to convince yourself to ignore suspicious signals or that a few bullish bars aren’t forming a bear trap. However, the longer you wait to exit a bad position, the greater your loss could be. It’s better to escape the trap quickly for a small loss than to let emotions guide your trading into a potentially large loss.
Bear Trap vs. Legitimate Bearish Move
Looking back at a chart, it should be easy to pick out bear traps from legitimate bearish moves. Bear traps are short-lived declines in the midst of a broader upward price trend. In many cases, bear traps are followed by a large move higher as bears who were caught in the trap are forced to buy shares to close their short positions.
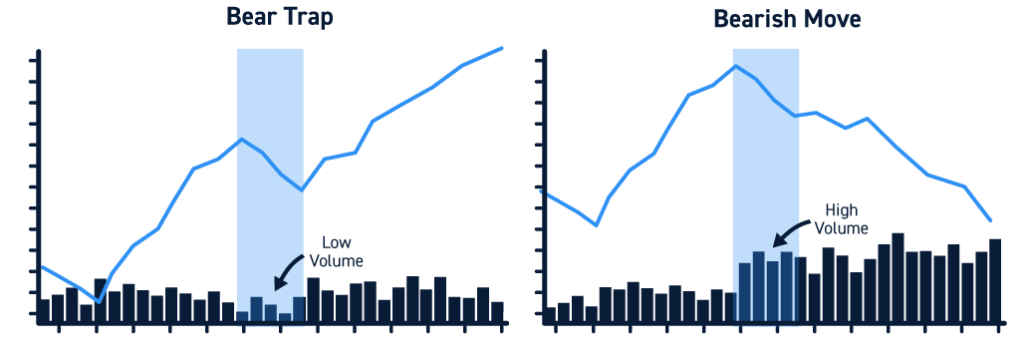
Legitimate bear moves are reversals from a prior uptrend. They typically retrace a significant portion of the uptrend’s gains and break through key support and Fibonacci levels in the process. A legitimate bear move may be ended by a bullish reversal or a shift to sideways price action.
Bear Traps vs. Bull Traps
Just as bear traps trick bears into losing money, bull traps trick bulls into losing money. Bull traps are the inverse of bear traps. They occur when a downward movement is broken by a short-lived uptick in price and bullish traders step in to buy the stock, only to have the downward movement resume.
Conclusion
Bear traps are downward price movements in the midst of a strong upward trend. They resemble reversals, but are short-lived and followed a resumption of the prior bullish trend. Bear traps can trick bearish traders into short selling a stock for a loss. To avoid bear traps, keep a close eye on trading volume, technical indicators, and Fibonacci levels that can confirm a reversal.


