

Online brokers enable traders to buy and sell stocks and options. While the larger mainstream online brokers insist they cater to every type of customer from investors to active traders, reality may be a different story.
There is a segment of customers that are very different from the majority of brokerage customers – the seasoned active trader population. While the mainstream retail brokers classify active traders as customers that make at least 30 trades per quarter, seasoned active traders can easily make that in single day (if not a single hour). These types of traders require specialized tools such as enhanced trading platforms, extensive short lists, and direct order routing. They also require a commission structure that allows them to navigate in and out of trades with ease.
This is where per-share commission structures come in.
Per-Share vs. Per-Trade Order Commissions
Until recently, most brokerage commissions schedules fell under two types of commission structures, per-trade and per-share.
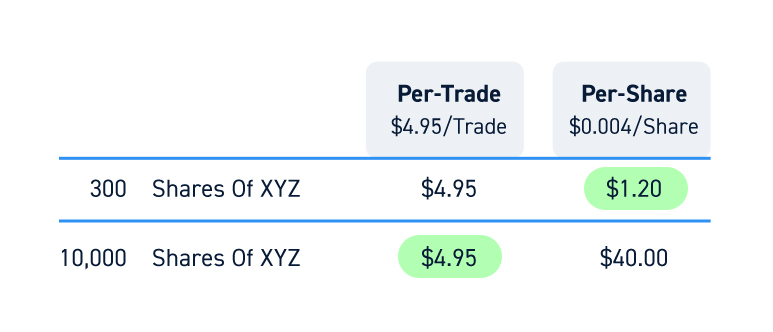
The per-trade commission schedule charges a flat fee (i.e. $4.95/trade) for unlimited shares (or a high cap on shares).
The per-share commission schedule charges per-share traded (i.e. $0.004/share).
On first glance, it may seem like the per-trade commission structure is the better bet, but that’s not always the case.
The per-share model can be rewarding for active traders. Generally, this commission structure incentivizes higher trade volumes with tiered per-share commissions based on monthly trading activity (i.e. rates ranging from $0.002-$0.004/share based on volume). The per-share nature of the pricing model allows traders to scale in and out of positions without racking up a full, per-ticket commission each time.
Additionally, the per-share model allows traders to receive commission rebates for providing liquidity. There are a few other benefits that we will discuss shortly, but first let’s look at how zero-commission trades impact our comparison.
Zero-Commission Trades
The rise of zero-commission mobile fintech broker apps has forced mainstream retail online brokers to reluctantly adopt zero-commission trading schedules to protect market share. However, the unprecedented volatility in equity markets of early 2020 exposed the structural inefficiencies of major fintech brokers as numerous customers suffered losses when overloaded trading apps malfunctioned, shutdown and locked out traders. Left with only e-mail customer support, customers were helpless to do anything with their frozen accounts as the S&P 500 collapsed over (-20 percent) in less than 10 trading day. They found out the hard way, “You get what you pay for”. These highly publicized outages underscored the complacency of mainstream broker customers and the inefficiencies with zero-commission fintech brokers.
Free commissions benefit investors who value the commission-savings over order execution speeds and control of order flow.
Per-share commissions benefit traders who value speed and agility over small, short-term cost savings.
Benefits of Per-Share Commission
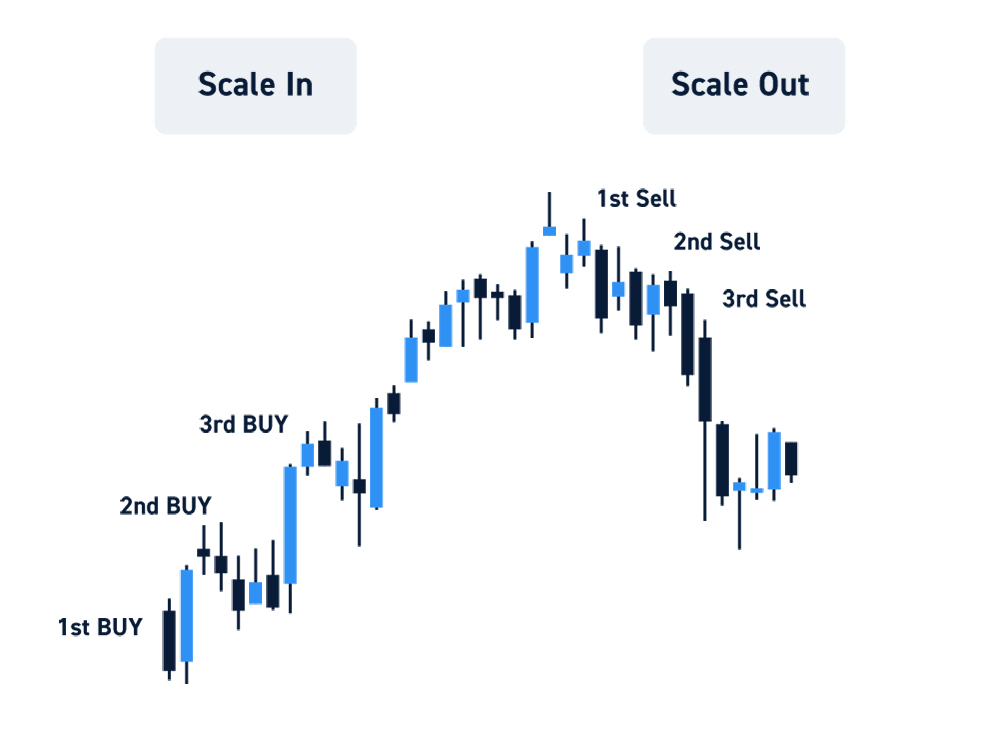
Per-share commissions enable traders to more efficiently scale in and out of positions to attain a better average price. Most per-share brokers enable direct order routing, which provides traders with quicker fills and more access to liquidity.
While ECNs have pass-through fees when taking liquidity, they also offer rebates for providing liquidity. Traders can configure their own preference of routes to routinely provide liquidity when possible to maximize rebates. Having access to ECNs and alternate trading systems (ATS) also allows traders to hide their transparency and mitigate market impact with “hidden” and “iceberg/reserve” orders. Essentially, per-trade commission structures give traders more control.
This is not possible with per-trade or zero-commission schedules since the order routing is left in the hands of the broker. This order flow is handled by the broker’s own market makers or sent to third-party broker-dealers through a pre-arranged agreement often times taking the order side of your trade.
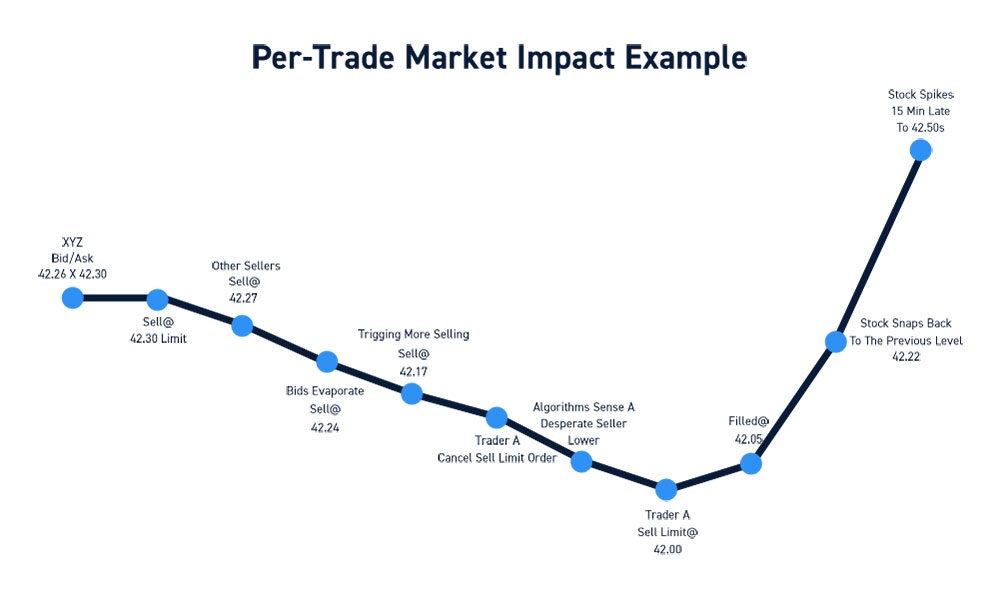
Hypothetical Market Impact Example Per-Trade: Trader A
Market impact can be felt but not often seen, very much like the wind. To better illustrate the material damage that market impact can have on your trading, let’s compare a hypothetical yet common scenario between two traders.
Trader A utilizes a zero-commission broker and Trader B utilizes a DMA broker that offers per-share commissions.
Let’s say stock XYZ is rapidly rising showing a bid/ask of 42.26 x 42.30 showing 200 shares on each side. Trader A uses a zero-commission broker to sell 5,000 shares at 42.30 limit. His order is immediately displayed on the inside ask on level 2. This causes other participants to quickly step in front of the 5,000 share sell order at 42.27 as the bids quickly evaporate to 42.24 triggering more sellers to hit the bids dropping the price to 42.15 x 41.17.
Trader A quickly cancels the limit order after noticing how fast his P/L blotter collapses and starts to chase the bid, which is rapidly falling. The algorithms sense a desperate seller and continue to pull bids lower. Ultimately, in a panic Trader A places a limit order at 42 to get filled at 42.05 average. After a sigh of relief, the stock quickly snaps back to 42.20 x 42.22 and relief turns into frustration when the stock proceeds to spike to 42.50s in the next 15-minutes.
Trader A abruptly impacted the momentum by displaying 5,000 shares on the ask when everyone was showing 200 share reserve orders. This prompted algorithms to pull bids as sellers rushed to sell ahead of the 5,000-share limit order. Trader A caused severe, yet temporary, market impact until shaken out of the position as markets resumed the uptrend.
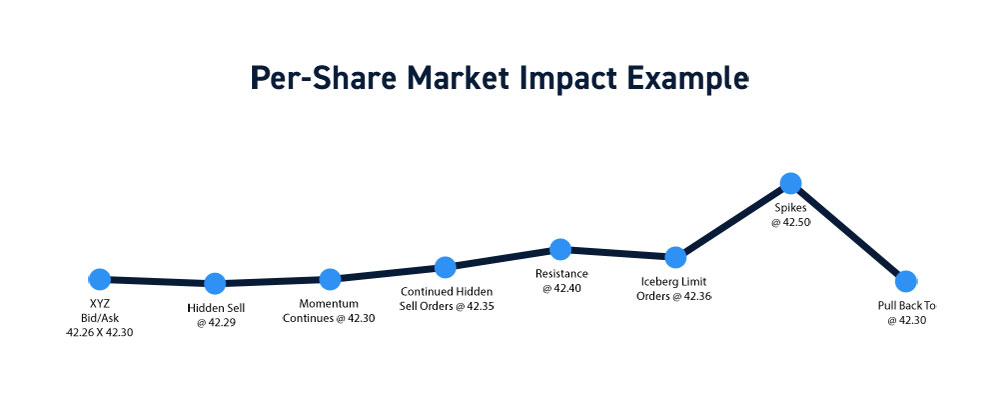
Hypothetical Market Impact Example Per-Share: Trader B
Trader B, using a per-share commission schedule, patiently waits as XYZ stock rises to 42.26 x 42.30 with 200 shares offered on both bid and ask.
As the bids rise, Trader B see volume coming in at 42.30 and discretely places “hidden” sell orders for 100 and 200 shares to see them get fetched up quickly at 42.29 as momentum continues to rise eating through 42.30.
As the bids swell at 42.32 x 42.35, Trader B places more “hidden” sell order in larger sizes 1,000 shares then 2,000 shares carefully watching time and sales print larger blocks. Trader B is aware of the resistance at 42.40 and unloads the rest of the shares with an iceberg order displaying only 100 shares on the inside ask at 42.37 which quickly get taken out as a 10,000-share bidder shows up at 42.36 bid.
XYZ stock continues to grind up as it spikes briefly to 42.50 before a reversion triggers a pullback to 42.30. Trader B was able to avoid market impact by discretely scaling out the 5,000-share position in smaller pieces with “hidden” and “iceberg” limit orders all the way up to 42.40 triggering the knee jerk spike to the 42.50 top. By selling into the momentum, Trader B also collected ECN passthrough rebates by providing liquidity. Most importantly, Trader B made very little market impact which enabled the momentum to continue building to a climax.
The Takeaways
Of course, the example above is fictional, but the outcome is very much a reality for many traders.
Trader A took tried to unload a position in a disruptive manner that ultimately led to lower P/L (despite commission savings).
Trader B displayed more seasoning with expert pacing and “grace under fire,” methodically scaling out of a large position with precision. This resulted in little market impact, commission rebates for liquidity and optimized scaled profits.
While Trader A could have unloaded the position in smaller chunks (using per-trade commissions), he likely lacked the tools to efficiently route his order for minimal market disruption.
Who is Per-Share Pricing Best For?
Per-share commissions are not for everyone. In fact, most investors will benefit from zero-commission brokers. That said, active traders benefit more from speed and control than they do from commission cost savings.
A faster execution and a better fill price easily justify the cost of a commission.
Traders who understand the delicate nature of market impact and want full control of their executions garner the most benefit. Having the ability to place hidden and iceberg orders is a huge advantage over per-trade or zero-commission schedules as it hides transparency and lessens market impact.
Market impact is very real even when not immediately visible. This is magnified multifold during pre-market and post-market trading when liquidity is thin, and transparency is even thinner. When trading very wide spreads, it’s imperative to be able to mask your true size or else risk getting chopped around.
The market impact example above underscores the profile of the type of traders best accommodated by the commission schedules. Newer traders can get their feet wet with the mainstream retail platforms to build up skill sets before upgrading to a DMA broker with per-trade commission schedules. However, serious active traders may want to get started on the right footing from the get-go with a DMA broker.


