

NASDAQ is the pioneer of electronic trading as it introduced the world to an alternative to the auction style open outcry style of order executions found on the New York Stock Exchange (NYSE). Rather than giving autonomous authority to a single specialist to control and manage order transactions for a stock, NASDAQ enabled competition between multiple market makers to provide the best price in order to win the order execution.
In the spirit of market efficiency, the advent of electronic communications networks (ECNs) also known as electronic order books were first introduced on the NASDAQ. This would be a gamechanger for the exchanges and participants as the freedom, convenience, liquidity, execution and speed of order books would transform the markets into more efficient ecosystems.
What is an Order Book?
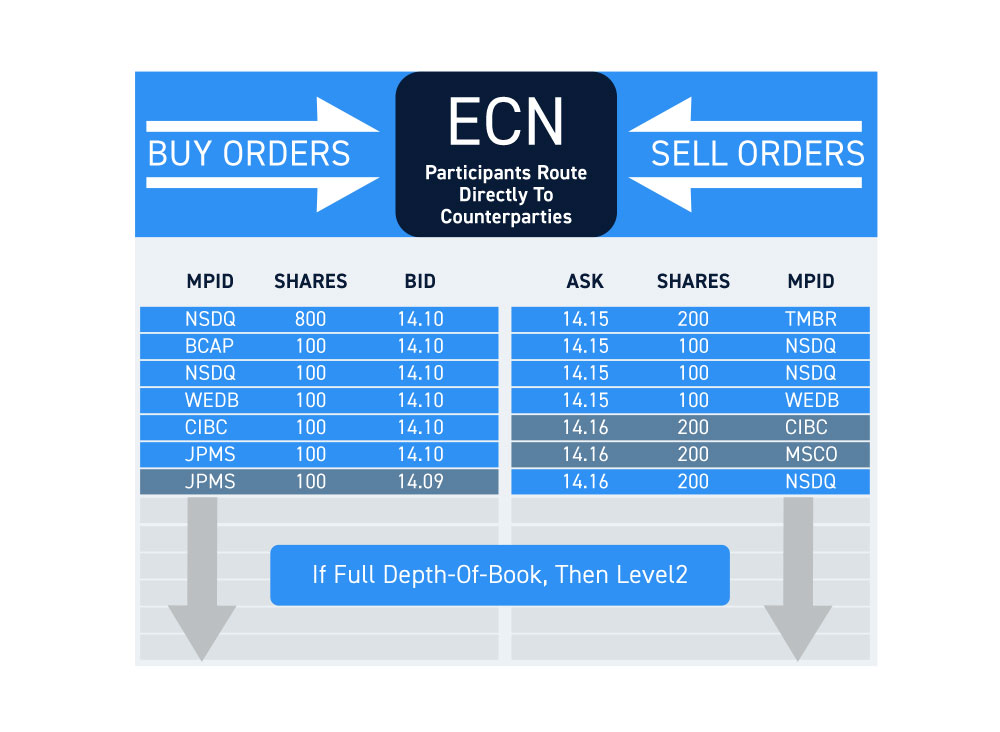
An order book is a list of buy and sell orders for a particular security.
An electronic order book executes trades when buy orders are matched with sell orders at specified prices. Electronic order books are referred to as ECNs, which operate without a middleman, leaving the participants to route directly to counterparties to fill their orders.
There are many ECNs and alternate trading systems (ATS) providing numerous direct routing opportunities through a direct market access (DMA) broker. These ECNs are also competing with market makers and other exchanges for the best price and availability of shares. These can be tracked on a level 2 screen, which provides the depth of participants with aggregate available orders and prices. A level 2 is basically an order book of order books and market makers.
What is NASDAQ Totalview?
While there are numerous ECNs and market makers, they don’t all display on a level 2 screen unless you are subscribed to the respective data feeds.
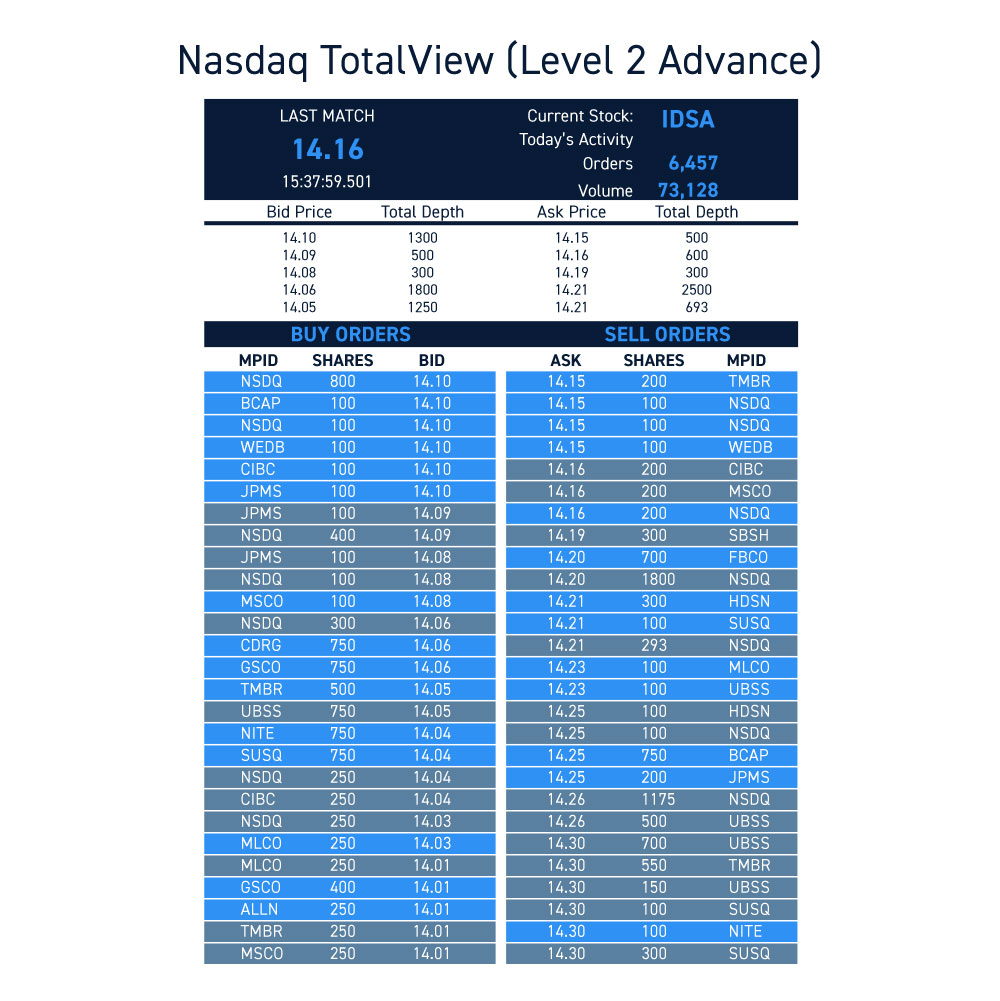
NASDAQ Totalview is a premium data feed subscription that displays the full order book depth on NASDAQ including every single quote and order at every price level for stocks. However, it won’t display quotes for “hidden” orders which can be placed through ECNs. Additionally, the order sizes displayed don’t always reflect the “real” order size as reserve/iceberg orders are often placed showing 100 shares when they are actually trying to sell 5,000 shares.
Basic NASDAQ level 2 displays market depth data for stocks beyond the inside/best bid and inside/best ask also referred to as the National Best Bid and Offer (NBBO). However, depending on your broker, your level 2 feed may only show a limited number of participants. NASDAQ Totalview provides up to 20X more depth and liquidity information as it displays all prices, order volume for NASDAQ stocks in real-time.
How to Read a NASDAQ Totalview Screen
A NASDAQ level 2 (also referred to as level II) window displays bidders with order sizes on the left and the counterparty sellers with order sizes on the right. Participants composed of market makers and ECNs are grouped top down by best available price starting from the inside bid and inside ask at the top. The inside bid and ask is also known as the level 1 quote, which reflects the current price. Throughout the day, the level 2 will constantly shift as buying and selling demand expands and contracts. When orders are filled, they are printed on the “tape” which is the Time and Sales window. This window is the “truth” serum because it displays actual executed trades.
The Importance of Analyzing an Order Book
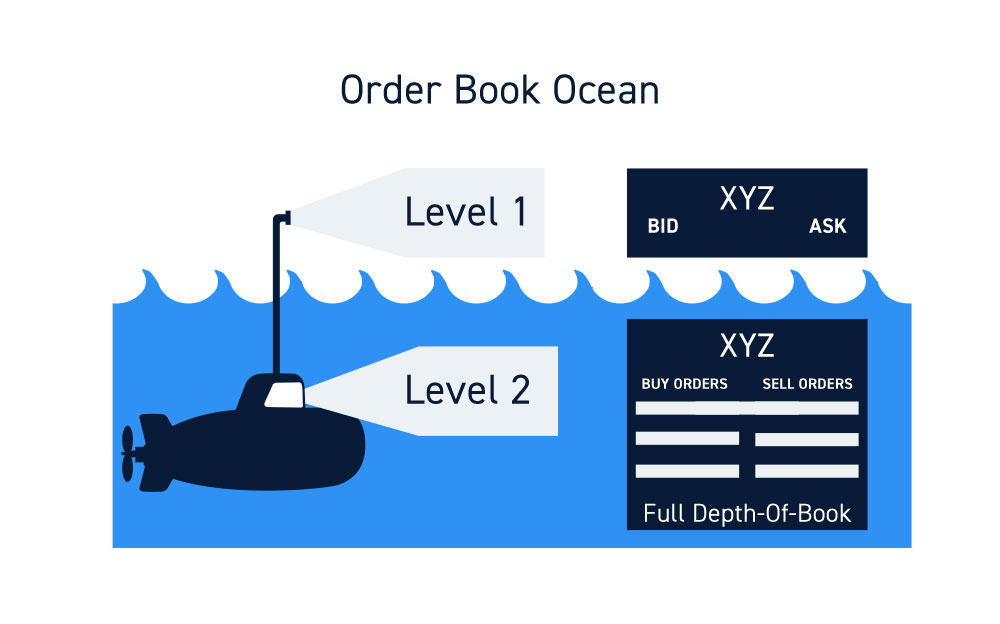
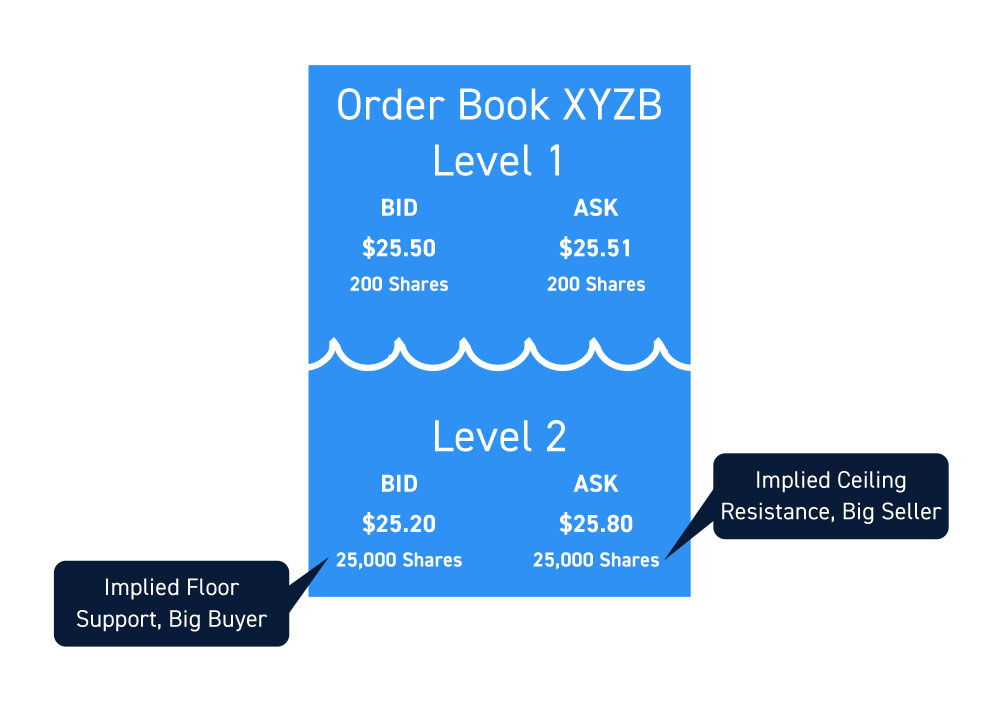
If you think of the market as an ocean, level 1 is the surface view above the water and level 2 is the depth of prices and orders below the surface.
The deeper the depth, the farther away the prices are from the current price. Being exposed to the depth of buyers and sellers can help to forecast the potential direction of near-term moves as well as floors and ceilings ahead of time.
Level 2 is akin to the undercurrents in an ocean. When a swarm of ECNs and market makers suddenly line up at a price two levels below the inside bid, that implies sudden buying pressure and price support. Imply being the key word.
While charts and time of sales windows are reflective of historical buying and selling activity, order books show real-time supply and demand levels that may help predict future price action.
Seeing is Not Necessarily Believing
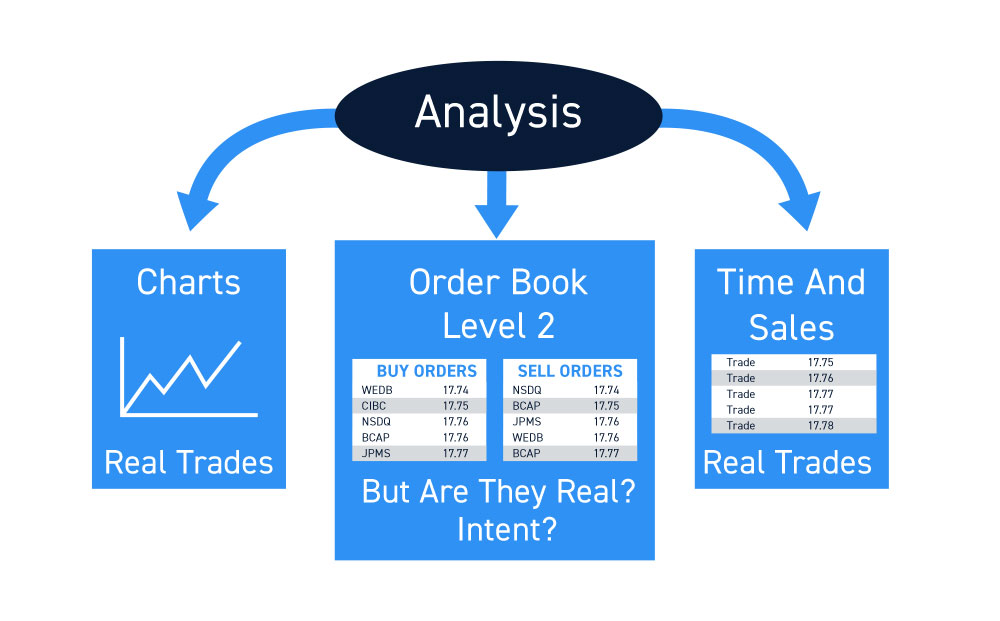
There are pros and cons with order books. The prime benefit of orders books is catching a glimpse of the current and near-term direction of price movement. However, this can also be a detriment as level can often distort the perception of buying or selling pressure with rapidly changing quotes but very little actual trades being executed. Therefore, it’s crucial to include the Time and Sales window and charts with your analysis. When a trade is filled and executed, it gets posted/printed on the Time and Sales window and plotted on a chart.
Charts display the historical price action based on trades executed so that traders can spot price trends and speculate on future direction. Remember that the bids and asks only imply the ‘intent’ of buying and selling, not actual buying or selling. Only when orders are matched, filled and executed does the intent become real. Orders book imply the future direction, but the charts confirm it with actual trade executions. In a nutshell, level 2 should be used in conjunction with Time and Sales and charts for a more complete analysis of price action.
What to Look for When Analyzing Totalview Orders
With so many moving parts on the Totalview level 2 screen, it can be overwhelming tracking the rapidly shifting quotes. Here are key things to look for:
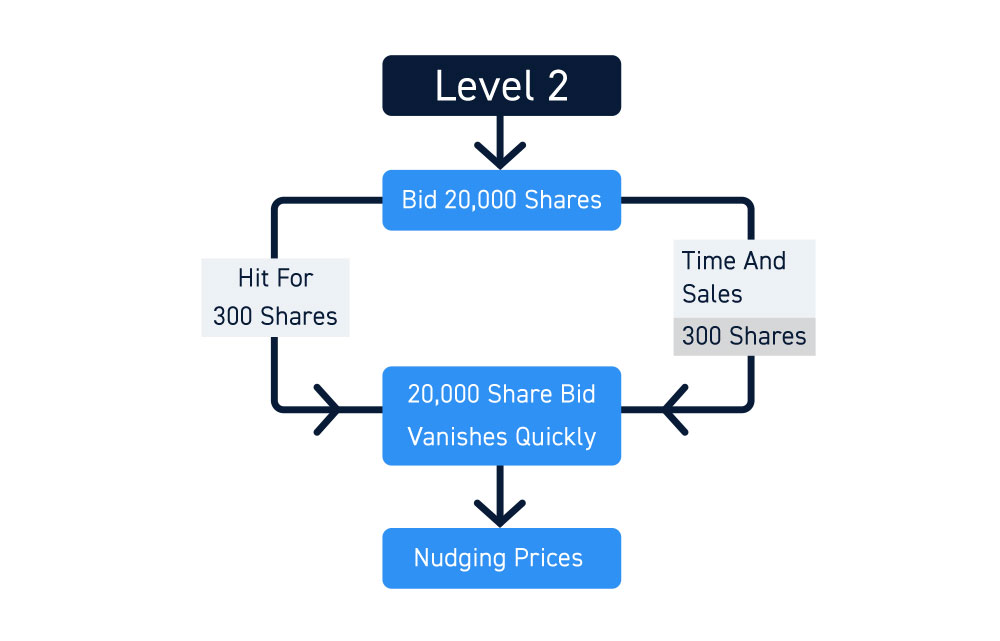
Large bid/ask size price quotes are placed on level 2 because the participant intends to execute a fill believing there is enough liquidity to absorb the order or is attempting to influence perception. When a large sized bid shows up, it can panic buyers to step in front thereby pushing prices higher near-term and vice versa when a large sized seller shows up on the ask. Whether their intent is to actually get filled or simply nudge prices can be determined on the Time and Sales window. If the price quote gets partially filled and the quote disappears, then it’s the latter. For example, a bidder places an inside bid with 20,000 shares and gets hit for 300 shares and quickly disappears. The 300 shares displays on Time and Sales and the level 2 shows the quote vanishing afterwards. It’s worth noting that the practices of displaying and pulling orders could be a form of spoofing or layering, which are market manipulation techniques that are in violation of federal law. Although they are illegal, that does not mean market participants are not out there pushing the limits of these rules. Be diligent and be aware.
Supply and demand imbalances are provided with NASDAQ Totalview and indicate near-term buy or sell imbalances usually reported at the end of the day. These may provide some insights into the near-term direction of price action but is often not relevant unless there is an extensive imbalance.
Future support and resistance
How to Get Access to NASDAQ Totalview
NASDAQ Totalview requires a data subscription agreement usually through your direct market access (DMA) broker. Conventional retail zero-commission brokers handle order routing in-house or through third-party order flow arrangements. They may provide a watered-down limited version of level 2, but without direct order routing or NASDAQ Totalview for full depth. For this reason, it’s prudent to have a market access broker that provides direct order routing capabilities to truly control your executions and take full advantage of Totalview.


