

Momentum trading is a popular trading style in which traders aim to take advantage of short-term price momentum. While trading momentum stocks can be lucrative, it’s a double edged sword that can cut hard and fast without the right preparation and trade management.
What is Momentum Trading?
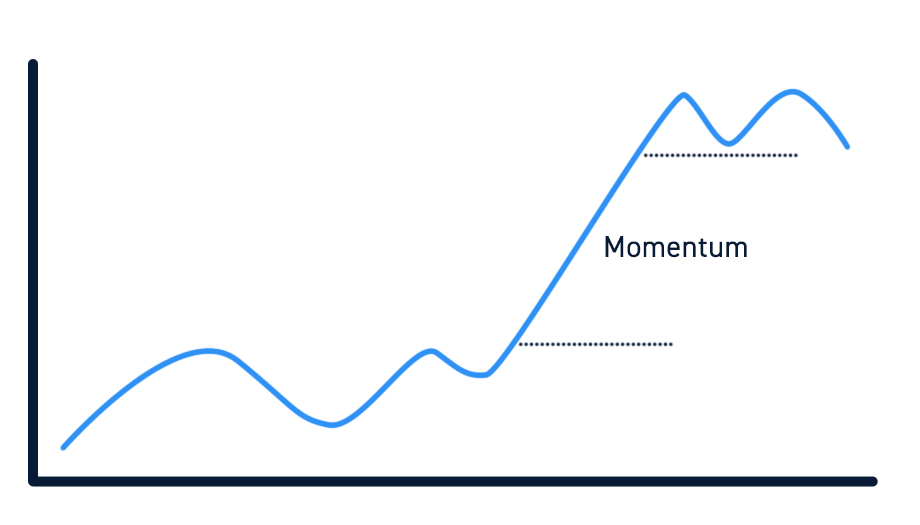
In a nutshell, momentum trading means trading “momentum” stocks. Momentum trading seeks to capture fast profits on stocks exhibiting outsized volatility and price swings.
Momentum stocks carry larger price swings with explosive volume that can reap big profits but also turn quickly. The high-risk/high-reward nature of riding momentum draws traders to these vehicles but can also leave a trail of blown out accounts. Fear of missing out (FOMO) and panic often drive these stocks both up and down.
Some stocks are inherently momentum driven while momentum can flow into random small-caps turning them into momentum stocks for just a period of days to weeks. Themes, binary events and news catalysts can turn regular stocks into momentum stocks that rise double to triple digits percentages on relative volume spikes in the 10X or higher range.
Momentum Trading Objectives
The top goal with trading momentum is to get in and out of a position with profits. This involves having clear objectives to minimize losses and maximize gains.
Trade Set-Ups, Not Companies
Keep in mind, that momentum stocks move on the explosive surge in volume that may not correlate with a company’s fundamentals. It’s common to see momentum flow into stocks trading at ridiculous multiples when applying conventional financial metrics.
There is a key distinction between the company operations and the company stock. Stocks move on buying and selling pressure which drives the momentum. Therefore, focus should be on the technical pattern set-ups, not the day to day operations. This requires a solid foundation of technical analysis, which is the study of chart patterns and indicators. Technical analysis enables you to analyze the price action and history to derive support, resistance and key price inflection points in order to map out a trading game plan to execute.
If you are a technical trader (as most momentum traders are), you should be guided by technical, not fundamentals. When you are trading a short-term move, the company’s earnings, management, and future deals are most likely irrelevant to your strategy. Momentum traders let price action speak the loudest.
Focus on Risk/Reward
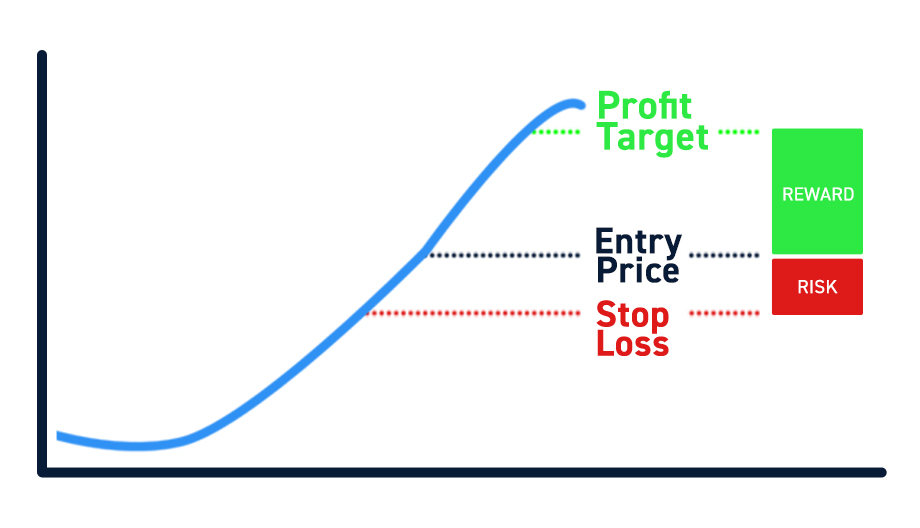
A good trading set up has a favorable risk/reward ratio. This is what allows successful momentum traders to generate consistent profits in the long run. Momentum traders should never risk more money than they expect to make.
Momentum traders look for high-probability setups with favorable risk/reward ratios. There are two important parts to focus on.
A high-probability setup is one that is likely to unfold a certain way. For example, a trader may recognize a certain chart pattern that results in a breakout 80% of the time. While the breakout has a 20% chance of failing, the odds favor a breakout (80%).
Traders manage the risk of failure by identifying a favorable risk/reward ratio. Using the example above, 80% odds wouldn’t be so great if the potential upside was $1/share and the potential downside was $10/share. However, if the trader was risking $1/share to potentially make $3/share, the trade would be favorable.
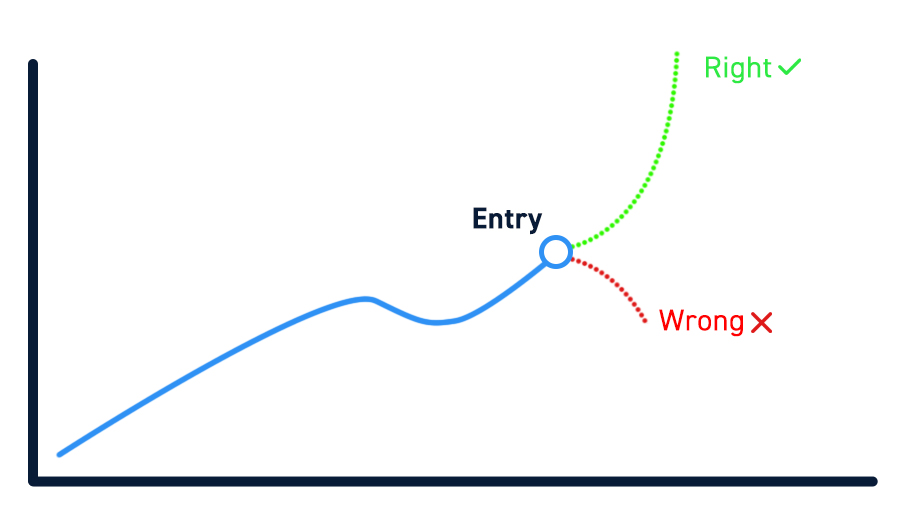
Use “Right/Wrong” Thesis
Momentum trading requires the agility to play both sides of the trade, long or short. This requires having an open mind to objectively state the right and wrong premises to justify both sides of the trade. It’s not as hard as it sounds. For every right premise to play the trade long, the opposite or failure of that premise is the wrong reason to not play the long or consider the short-sell. State your premises that comprise your thesis with, “I believe the stock will do (X) because of (Y1…Y4). The X is the outcome, the Ys are the premises that comprise the thesis or justification for the trade. Here’s an example:
“I believe XYZ currently trading at $25.02 will reach $25.70 target (X) because of:
Y1 = $25.10 is the breakout trigger on the 60-minute ascending triangle pattern
Y2 = 5-minute stochastic is crossing back up through the 20-band
Y3 = Support has been rising to $24.90 with rising relative volume
Y4 = Competitor stock XZY is hitting the intraday high on 4X volume
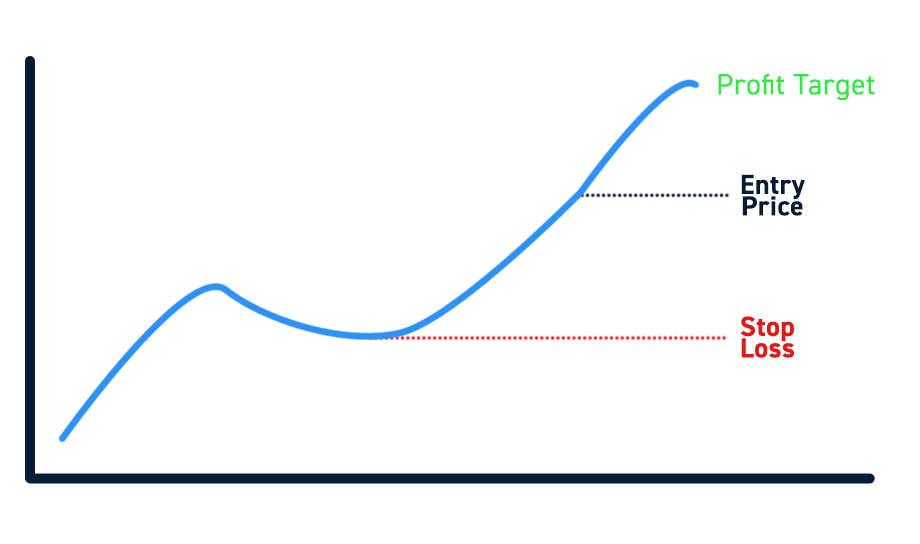
Game plan: Buy 1,000 shares of XYZ long at the $25.10 trigger limit, with a stop-loss at $24.90 for (-$0.20) versus an upside target at $25.70 for a $0.60 profit = 1:3 risk vs. reward ratio.
That’s a solid game plan. Execution is the next and most important factor in trading momentum. As they say, the fault rarely lies in the game plan, it lies in the execution.
Momentum Trading Tools
To ensure seamless execution of your game plan and the perpetual supply of new trade ideas, momentum trading requires several essential tools. Don’t skimp on the tools as all the risk management in the world can’t save you if your tools are unstable and unreliable.
Direct Market Access (DMA) Broker
If you want to maintain an edge with momentum trading, you’d likely want direct order routing to help ensure lightning-fast fills and confirmations. The ability to tap into reserve/iceberg and even cloaked/hidden orders while collecting ECN passthrough rebates can be one advantage available through a DMA broker aka a day trading broker.
DMA brokers provide specialized trading platforms without the resource hogging cosmetic (and useless) overload bells and whistles. They keep the trader in mind focused on speed and efficiency by providing cutting edge execution, advanced charting, level 2 and time and sales, scanners, point and click execution, short locates embedded into the platform, hot keys and a multitude of order execution options.
Seasoned momentum traders know that transparency is the most valuable aspect of trading. DMA brokers give you full control of literally every aspect of your trading executions and management as well as provide robust data and platform stability. This is required for efficient momentum trading.
How Does Momentum Trading Compare to Other Trading Styles?
Momentum trading is the flashiest and most exciting form of trading that gets the most attention. It requires the most efficient tools including a DMA broker with the essential execution and analysis tools like level 2, advanced charts and direct routing capabilities. How does momentum trading compare or differ with other styles of trading? Let’s examine the similarities.
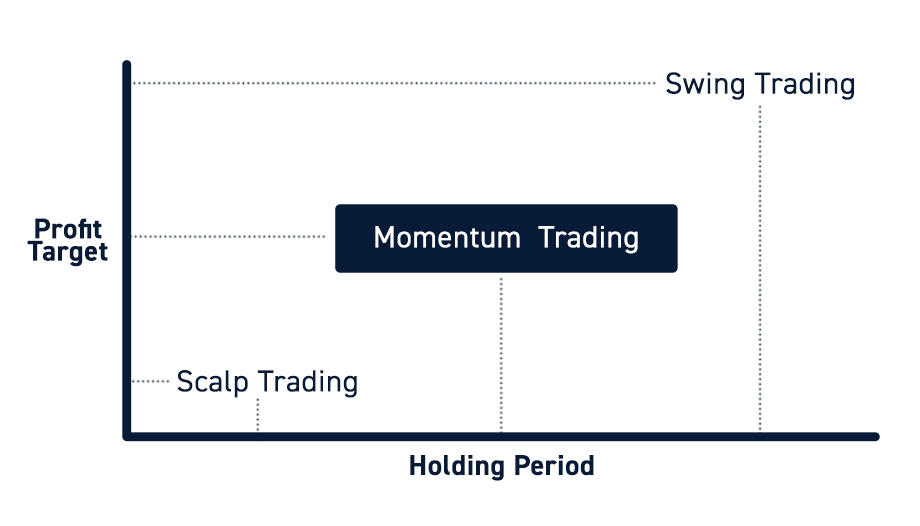
Momentum Trading vs. Swing Trading
Momentum trading requires precision order routing and speediest executions and confirmations. It’s usually performed intraday with minute to minute tracking and smaller holding periods.
Swing trading utilizes wider time frames that usually require holding periods from overnight to multiple days and even weeks. Precision fills are not as important since the objective is to capture larger price swings and giving set-ups more time to play out. These set-ups can take much longer and consider sitting through larger drawdowns before the pattern plays out.
Swing trading is almost passive investing compared to the active nature of momentum trading. Momentum traders will argue that swing trading is riskier because of the overnight holding period where the trader has no control over potential price gaps down based on other factors like the S&P 500 futures.
Momentum Trading vs. Scalp Trading
Scalp trading is often applied to momentum stocks. Momentum trading is mostly aligned with scalp trading where traders capitalize on smaller price fluctuations of the larger move. Scalping modifies the approach to risk management by focusing more heavily on the probability component of the equation.
This means scalpers will take a worse risk to reward trade because the high probability tilts towards hitting the price target before the stop-loss. Scalpers measure risk by share position size tempered by holding time. This means even a 3:1 risk to reward trade with the potential to lose (-$300) versus making a +$100 profit is viable because the probability of making $100 first before triggering the (-$300) stop loss is 90% or greater. Also, a scalper believes in taking precaution stops at breakeven often in order to buy time to reenter when probability rises again. This exhibition of agility is the core quality that seasoned scalpers exhibit as they trade momentum stocks.


