

On the surface, executing a trade seems as simple as clicking the BUY button and then clicking the SELL button shortly after. Just like the proverbial iceberg theory, only 20% of an iceberg is visible above the surface. The majority of the iceberg is under the surface. Like trading, the outcome of a trade is visible. However, the process behind the trade is what determines the outcome. This is not-so visible. This is also where the most legwork takes place.
The Importance of Planning
Plan your trade and trade your plan. This is a common theme but one that’s not so commonly practiced. The process behind carefully planning out all aspects of the trade is one that should be hard wired and consistently repeated so that it becomes habit. The efficiency of completing the process improves with time and experience.
The Five-Step Process Behind Every Trade
The “under the surface” process is where the real work begins. The five-step process behind every trade is something that you may already be performing partially. This is a review into the precise actions to take in order to fortify the routine. The stock market tries its best to break consistency on every level. The only thing you can control is your own actions. Consistency begets consistency. We will review each step and present the goal of the step and the outcome.
Step One: Discovery
Goal: Find potential stocks to trade.
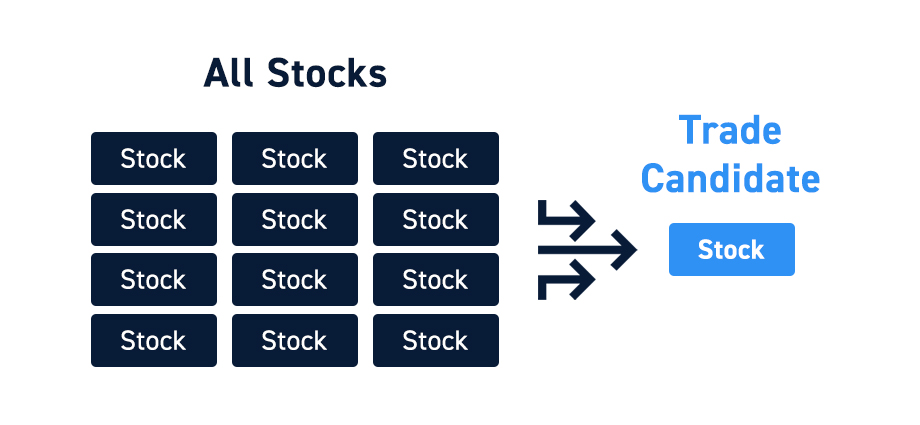
This process requires scanning and filtering through different sources to find ideal stocks to trade. The sources can include financial news networks, social media, tickers, scanners and news headlines. Make sure to define your criteria and parameters. This can include stocks that fall into specific industries, average daily volume, news catalysts, technical patterns and/or themes and liquidity. Initially, the goal will be to familiarize yourself with individual stocks and their price behaviors. It’s a good idea to segment stocks by sectors and industries since they tend to move as a group. This enables you to compare the relative price action of one against its peers which may provide lead and laggard trade opportunities.
Outcome: Start building your watch list. All the precious research and legwork you put into this step should result creating and building upon watch lists. Your watch lists are stocks that you become familiar with, which improves your efficiency.
Step Two: Analysis
Goal: Analyze a set-up to determine if there is a trade opportunity.
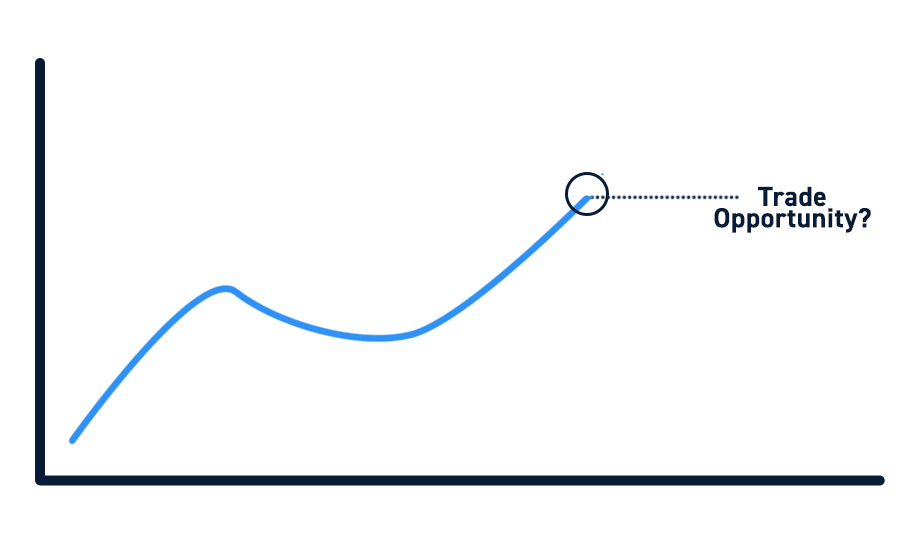
Every trader has their own analysis techniques to determine if a stock is worthy of making a trade. The key is creating your own process for identifying set-ups. This requires answering questions about the criteria. What are the criteria for taking a trade and what are the criteria for avoiding a trade? Continue to refine the criteria if it’s not specific enough or helpful in making your decision. For example, your criteria could be comprised of stocks in the semiconductor sector under $75-per share triggering a daily ascending triangle breakout with a rising MACD.
Outcome: Deriving the initial trade game plan. As you find the small number of stocks that fit the day’s criteria, you can then place the triggers for the set-up based on either price, indicator or both. As the market opens, you can now methodically monitor and track the specific stocks on your watch list that meet your criteria to trigger.
Step Three: Game Planning
Goal: Plan your trade
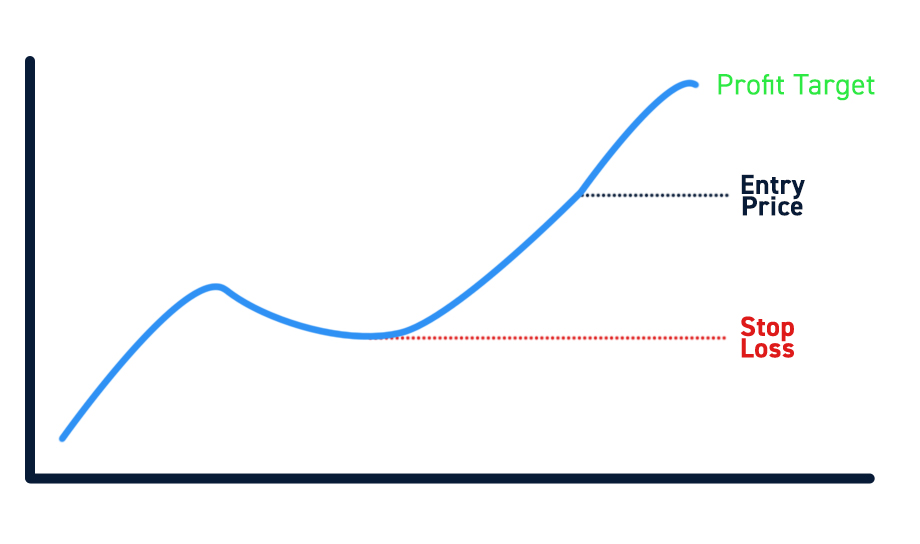
Initially, it’s important to cover all aspects of the trade going through each component methodically so that the trade plays out robotically. Put it together in a way that it can be executed by an algorithm. This requires precise clarity. Here is a checklist of the components to factor in:
- Trigger: What is the exact trigger for executing the trade? (IE: $XYZ breakout through the $25 resistance)
- Entry Price: What is the entry price for your limit order if the stock triggers?
- Position Size: What is the size of the position to accompany your limit order? (IE: Buy 500 shares of $XYZ at $25.07 limit on a trigger breakout of $25)
- Stop-Loss: What is the stop-loss for this trade? It can be price, indicator or dollar-amount based. (IE: Stop-loss is $24.69 just below the $27.75 moving average support)
- Profit-Target: This is something many traders leave out. They are so precise about what a stop-loss would be but fail to have a profit target ready and instead opt to let their winner ride. A good method is to place profit targets just ahead of price resistance levels on longs and above support levels on shorts. (IE: Profit target is $25.48 just below the upper Bollinger Band)
- Timeframe: This refers to which timeframe are you prioritizing? If the breakout is triggering on the 5-minute timeframe chart, then it calls for prioritizing the indicators for that timeframe. If multiple timeframes support the trade, then coordinate the position sizing to applicable time frames. (IE: 500 shares long of $XYZ for 5-minute timeframe chart breakout or 200 shares long for a 15-minute timeframe breakout.)
Outcome: Create the full trade plan. (IE: Buy 500 shares of $XYZ at $25.07 limit price for an upside target of $25.48 and a hard stop at $24.69 based on the $25 breakout trigger on the 5-minute ascending triangle pattern.)
Step Four: Execution
Goal: Trade your plan.
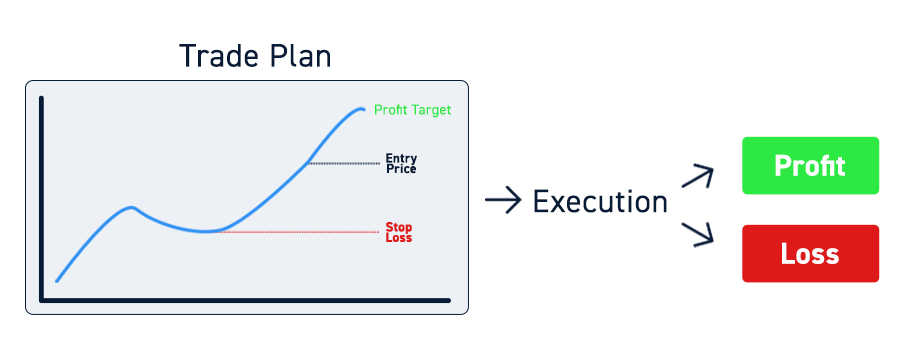
Like an algorithm, be robotic and follow the trade plan you created. If you are using a direct market access (DMA) brokerage platform, then you will also consider the order routing preferences unless opting to use a Smart Route. The use of reserve and hidden orders is also something to consider with direct routing to electronic communication networks (ECNs).
Outcome: Be robotic but also adaptive as conditions change. By following Steps one-through-three, the outcome will either be a profit or a stop-loss. If your analysis is right, then your profits may outweigh your stop-losses.
Step Five: Post-Trade Analysis
Goal: Find key takeaways from the trade so you can refine various elements of your process to improve efficiency and performance.
After each trade, it’s prudent to follow through with the post-trade analysis by answering these questions:
- What did I do right? (IE: Good execution on the trigger filled $XYZ at $25.05)
- What did I do wrong? (IE: Took profits too soon at $25.35)
- Was there anything missing in my previous analysis? (IE: The daily and 60-minute charts also triggered the larger breakout above $25 trigger which should have given me more confidence to hold the position longer)
- Did I stray from the game plan? (IE: Yes, I took profits too soon)
- Was this a comfortable trade for me? (IE: Yes, until I started making profits)
- Do I want to find more trades like this? (IE: Yes, definitely!)
- If this trade was a loser, was it a good loser (properly managed)? If not, what should I have done? (IE: The trade never got too close to my stop-loss as it held the $25 price on pullbacks before it eventually grinded to $25.75)
- What is the takeaway from this trade? (IE: I took profits too soon, which is a good problem to have. However, when multiple time frames converge on the same trigger, I should try to hold my position longer by scaling down the position so I remain in my comfort zone with position sizing.)
Outcome: Deriving new insights to create more refined criteria and trading rules to apply to your process. This is how you learn and evolve. This is how you derive value from losing trades because the takeaway knowledge can be considered tuition, if you make the effort to engage in the final step of post-trade analysis consistently.


