

Seasoned traders know that price, liquidity and execution are the cornerstones for the success of any trading strategy and methodology. The stock markets have evolved from open outcry (auction-style) operations with human specialists taking orders to electronic markets providing lightning fast fills with greater transparency. This is made possible with the advent of electronic communications networks (ECNs) which are essentially virtual limit order books that match buyers and sellers. The largest limit books took on the structure as their own exchanges as alternate trading systems (ATS).
What is an Order Book?
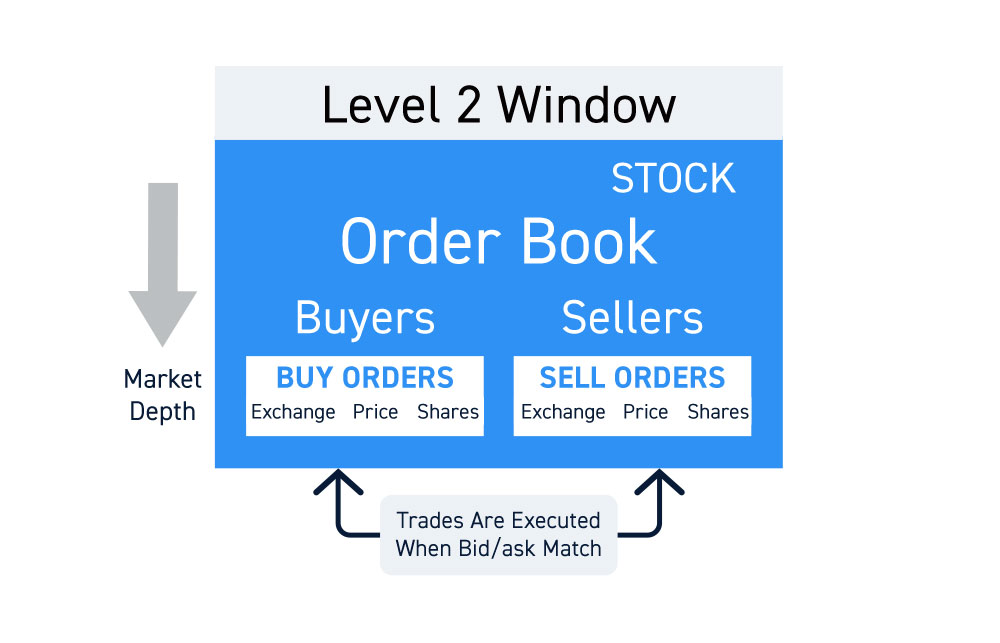
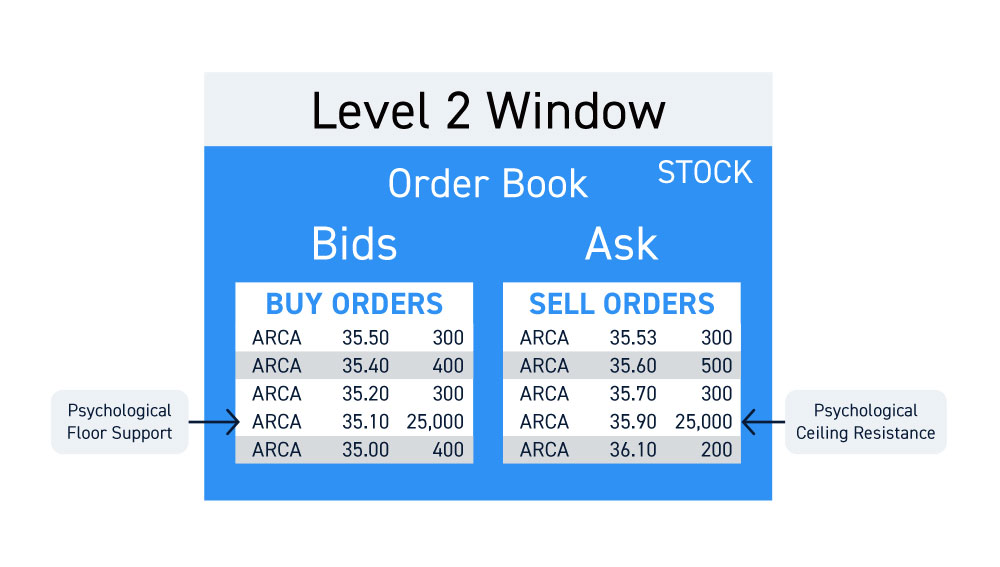
An order book is displayed through a level 2 window showing buyers on the left side and sellers on the right side accompanied by their respective prices and available shares. This represents the market depth for any trading stock. Stock markets are composed of two counterparties, buyers and sellers. Trades are executed when a buyer’s request matches a seller’s offer and vice versa when a seller matches a buyer.
Trading exchanges originated with floor specialists who would manually match buyers with sellers taking on the risk of slippage to profiting from the spread. This auction style order matching has literally been replaced with advent of ECNs which enabled buyers and sellers to instantly route orders directly to each other, without a middleman. The convenience, transparency and speed of execution caused the migration of traders to electronic order books.
What is an ArcaBook?
The NYSE ArcaBook displays the full limit order book in real time for NYSE Arca traded stocks. The proprietary data enables traders to see the full market depth of buyers and sellers on ArcaBook through a level 2 screen. It displays the price and aggregate liquidity in available shares. This is significant for traders who wish to bypass middleman and route directly to counterparties in the ArcaBook. Point and click execution for instant fill and trade confirmations are a key benefit of using ArcaBook. It’s also the most liquid order book by having the most participants and volume of available shares and orders.
Keep in mind that there is gamesmanship involved as not all share sizes are truly representative of what counterparties are actually buying or selling. Remember that level 2 order limited indicate the “intent” to buy and sell, but not the actual executed trades. These are found in the Time and Sales window.
Reserve and Iceberg Orders
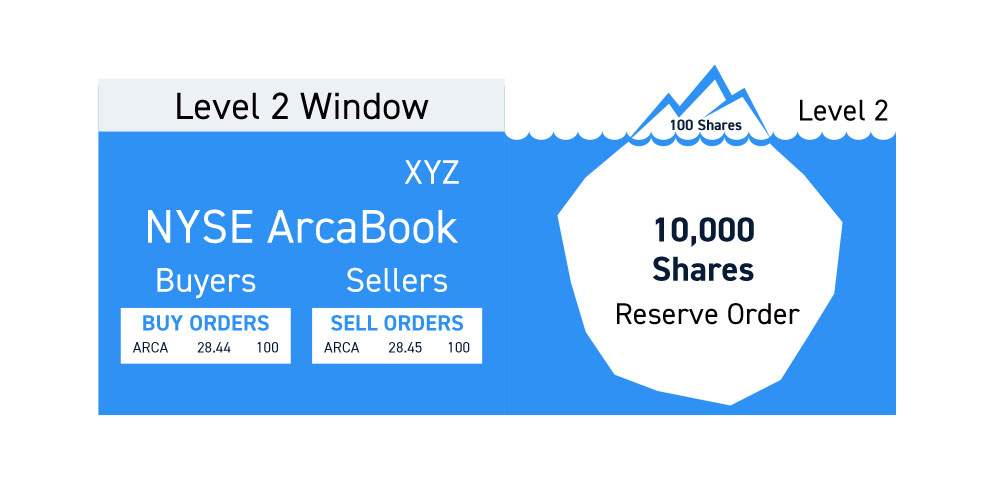
Trading is about transparency, gaining it without providing it. Therefore, ArcaBook as well as other ECNs enable the option to “disguise” the actual share sizes offered through reserve orders. Reserve orders are also referred to as iceberg orders since they resemble an iceberg with only the narrow tip showing above the water while the massive foundation is hidden below the water. For example, a seller that wishes to sell 10,000 shares of XYZ can configure the trade to display just 100 shares on level 2 while setting the reserve quantity to 10,000 shares. The motive is to hide transparency so as not to make too much market impact. Depending on the underlying stock, a 10,000 share sell offer displayed on the ask could immediately panic other sellers to step in front of the order with a lower offer price.
The cascading effect of falling ask prices can result in a short-term price drop as buyers drop their bid prices to “shake the trees” to get a better fill. Eventually, it would lead to less liquidity and a poorly executed exit on the shares. The best way to verify if a quote on level 2 is the true size is to match the executed trades on the Time and Sales window.
ArcaBook vs. Basic Level 2
Basic level 2 displays the aggregate totals for participating ECNs at each price level. The number of ECNs and price levels displayed also depends on your broker and trading platform. Some retail brokers may only display one or two ECNs, while a direct access broker may display numerous ECNs. Your broker may have a basic level 2 package that may include level 1 Arca limit orders which doesn’t provide the full depth on level 2. ArcaBook displays the full depth of ARCA order limits on level 2. Considering it’s the largest ECN/ATS, you will need to subscribe to get the full quotes, which display the aggregate displayed total for order size at every single price level.
How to Read an ArcaBook Screen
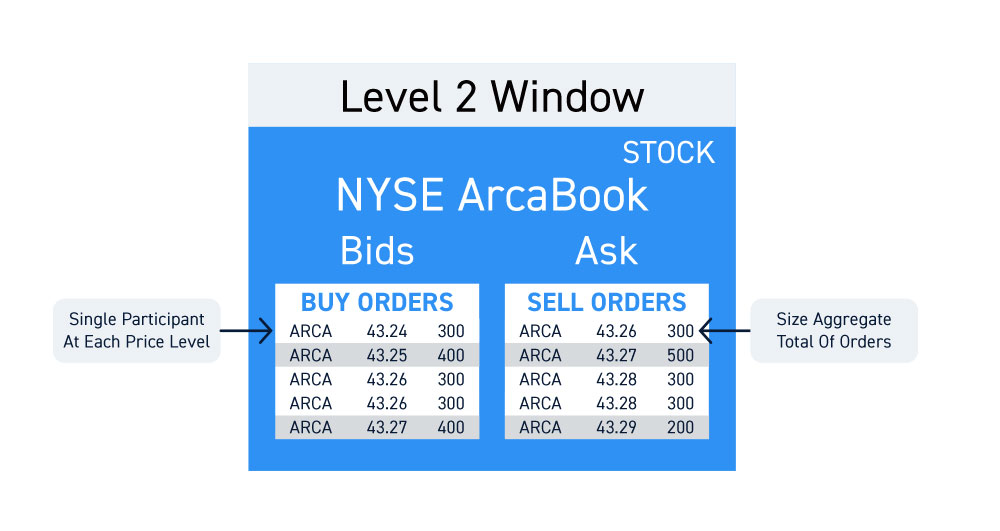
ArcaBook quotes are represented on the level 2 screen as “ARCA” or “ARCX” depending on your trading platform. The level 2 screen is composed of participants with bids on the left and asks (also referred to as offers) on the right. ARCA is listed as a single participant at each price level, but the displayed size is an aggregate total of orders. They represent the “intent” but not necessarily the “real” order size. It’s worth noting that the practices of displaying and pulling orders, even when there are partial fills, could be a form of spoofing or layering, which are market manipulation techniques that are in violation of federal law. Although they are illegal, that does not mean market participants are not out there pushing the limits of these rules. Be diligent and be aware.
Market makers are professionals required to post both a bid and accompanying ask limit order. ARCA users can be retail traders or professionals with no obligation to post orders on both sides. Due to the popularity of ARCA, quotes usually appear on both the bid and ask simultaneously indicating consistent liquidity and participants.
The Importance of Analyzing an Order Book
The level 2 provides market depth composed of “live” real-time supply and demand intent. As mentioned earlier, all is not as it seems on level 2. Actual executed trades are displayed on the Time and Sales window and plotted on charts. Charts are used to gauge potential future price action based on historical data of executed trades.
A glimpse into the future short-term price movement can often be gauged through level 2 as order books reflect the direction of price. For example, a large “sweep” order can be made through ARCA showing large size on a rising bid price that causes the asks to tick higher, indicating strong buying pressure/demand. Executed trades at quickly escalating prices are posted on Time and Sales and plotted on the charts. This sequence originally started with the accelerating price moves indicated on the order books, making them one component in gauging the “bigger picture” of an underlying stock’s price action.
What to Look For When Analyzing ArcaBook Orders
Since ARCA is the largest exchange, it is important to loosely track the activity of ArcaBook. Unlike market makers, ARCA represents unlimited participants whereas a market maker can be singled out to one firm executing orders. However, as a group of participants, ARCA is a major force in the movement of price. The outlier moments are key tells:
Large ARCA bid/asks with sizes over 10,000 shares implies aggressive buyers or sellers. When ARCA displays large sizes, it indicates there is enough liquidity to absorb the size, or the intent to make market impact pushing price the other way. This is gamesmanship. If a market maker needs to fill a client order at cheaper prices, they may display 25,000 shares on the ask through ARCA to induce panic sellers while risking the possibility of getting hit. The size of orders is relative to the liquidity of the underlying stock and what is normally displayed.
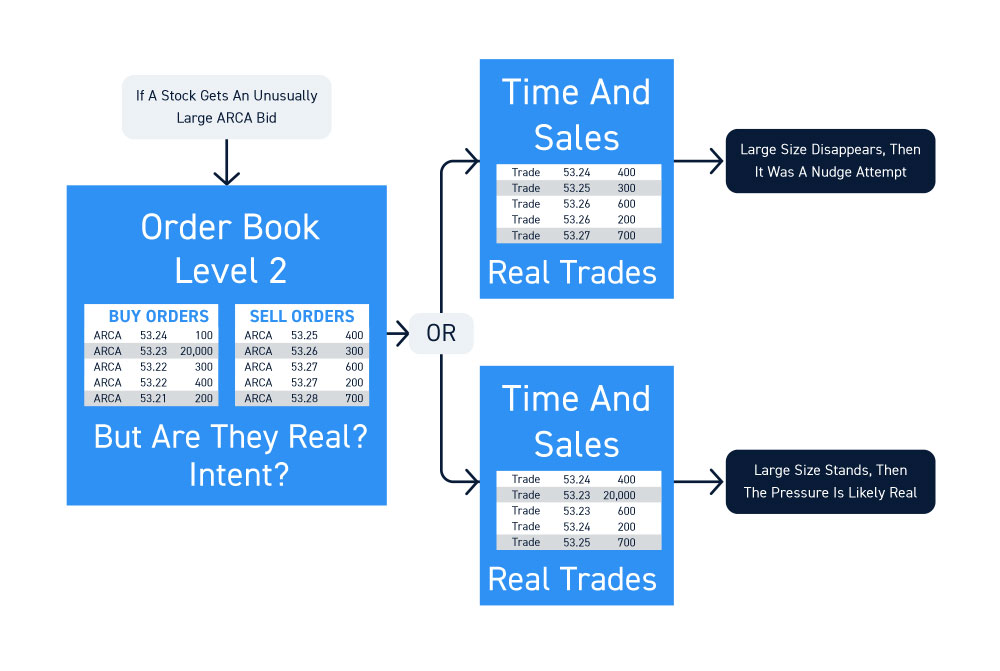
If a stock regularly shows order sizes from 100 to 2,000 shares, then a 20,000 share ARCA bid or ask is an outlier to monitor. This can indicate a big buyer or seller, or just an attempt to “nudge” and “shake the trees” to move prices into their favor. The Time and Sales is the proof. If the large size disappears after being hit for 300 shares, then it was a nudge attempt. However, if the size stands and absorbs the liquidity, then the pressure is likely real.
Supply and Demand Imbalances
NYSE ArcaBook will post real-time buy and sell imbalances during specified intervals throughout the trading day. While this may seem important, it’s old news usually posted before the close and not as reflective of the direction into the close.
Future Supply and Resistance Levels
When there is heavy order sizes clustered as specific prices on level 2, it implies a floor or ceiling for stock prices. However, when these prices are many levels beyond the inside (also referred to as best) bid and ask, they can’t be validated until actually tested. In the meantime, they create the perception of a support or resistance and perception is reality until tested. For example, if XYZ is trading at an inside bid and ask of $35.50 x $35.53 for 300 shares each, it may seem thin liquidity. However, if the ArcaBook displays large orders at the outside bid and ask prices of $35.10 and $35.90 with 25,000 shares on both sides, that provides a psychological floor support and ceiling resistance.
How to Get Access to ArcaBook
ArcaBook access requires a data subscription agreement usually through your direct market access (DMA) broker. Conventional retail zero-commission brokers handle order routing in-house or through third-party order flow agreements so they won’t provide access to ECNs. For this reason, it’s prudent to have a market access broker that provides direct order routing capabilities to truly control your executions and take full advantage of ArcaBook.


