

Gaps in a stock chart occur when the price of a stock moves suddenly up or down, usually in response to news outside of market hours. In some cases, these gaps don’t last – rather, they’re “filled” as trading action brings the price back towards the previous close. These gap fills present opportunities for trading.
In this guide, we’ll explain what gaps are in stocks, how gap fills work, and how you may trade around gaps.
What is a “Gap”?
A gap in a stock occurs when a stock’s price jumps between the close of one candlestick and the open of the next. Typically, this is seen on daily charts when a stock opens at a very different price than the price at which it closed the day before.
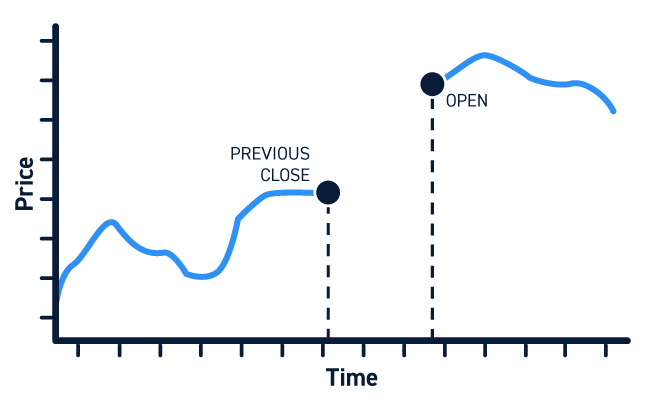
Stocks can gap up or down. A gap up happens when a stock opens above the top of the previous candlestick. A gap down happens when a stock opens below the bottom of the previous candlestick.
Gaps typically happen in response to news or other events and usually after market hours when there isn’t a chance for the stock price to rebound due to lower trading volumes. For example, a positive earnings report after market close could cause the price of a stock to gap up.
Types of Gaps
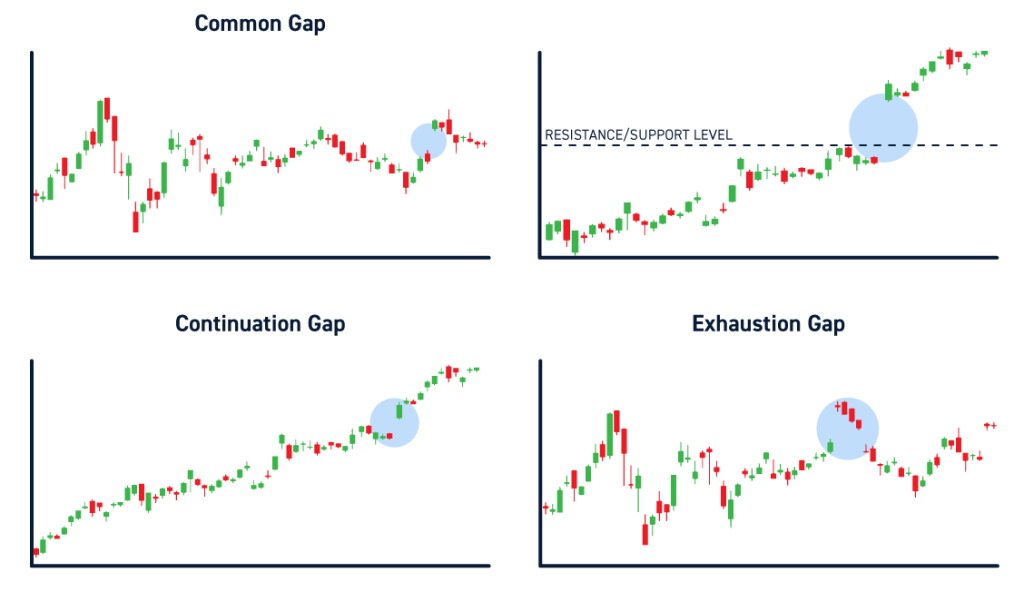
There are four different types of gaps that can occur:
- Common gaps occur without an underlying trend or event. They frequently occur in stocks with low liquidity.
- Breakaway gaps occur when a gap jumps above a resistance level or below a support level. These gaps are much like traditional breakouts or breakdowns, except that there is a gap where the breakout candlestick would normally be.
- Continuation gaps occur in the middle of a strong trend, in the direction of the trend. They are usually caused by a sudden increase in buying or selling action.
- Exhaustion gaps look a lot like breakaway gaps, but they signal a coming trend reversal. Exhaustion gaps typically occur on low trading volume, while breakaway gaps occur on high volume.
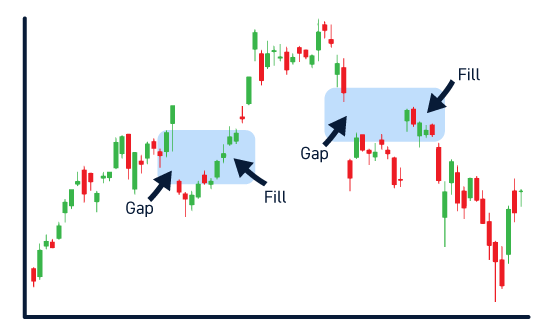
What is a Gap Fill?
A gap is said to “fill” when the price of a stock moves back to the pre-gap level. After a gap up, this means that the price falls back to the top of the pre-gap candlestick. After a gap down, this means that the price rises to the bottom of the pre-gap candlestick.
Gap fills can occur for a variety of reasons. In many cases, gaps fill because the original gap was an overreaction to news. After earnings reports, gaps often fill as investors look past a good or bad-sounding headline and dig deeper into the guidance.
Gaps can also fill for technical reasons. When a gap occurs, there is typically no support or resistance in between a stock’s new price and its pre-gap price. Once a stock’s price begins to fall after a gap up (or rise after a gap down), there is little to stop it from filling the gap.
Gaps can fill during the same day they form or they can take several days to fill.
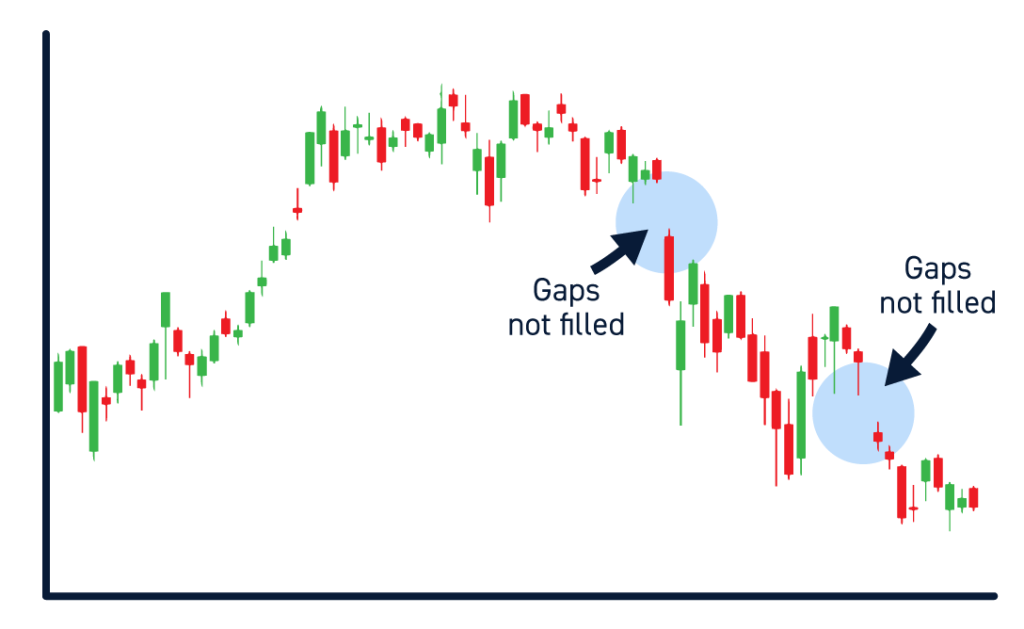
Do Stocks Need to Fill Gaps?
Importantly, gaps do not always fill. Traders should never assume that a gap will fill without understanding the reasons for the gap and monitoring trading activity around the gap. Breakaway gaps often do not fill, or fill only partially since the broken support or resistance area serves as resistance or support during gap filling action.
How to Trade Gap Fills
There are many different strategies traders can use to trade gaps and gap fills. The appropriate strategy will depend on the type of gap, the reason behind a gap, whether there is a strong underlying price trend, and whether a gap or fill action is associated with increased volume.
Regardless of your strategy, there are some important things to keep in mind when trading gap fills. First, remember that gaps don’t always fill. But except in the case of breakaway gaps, they usually complete a fill once fill action begins since there is no support or resistance in the way.
You should also keep an eye on trading volume. High trading volume in the direction of a gap is usually a sign that the gap will continue rather than fill, especially if the gap is in the same direction as an underlying trend. Low volume typically signals an exhaustion gap or a coming fill.
Finally, be patient when trading gaps. It’s better to get the direction of a continuation or fill correct than to enter a position too early and be proven wrong in your analysis.
Conclusion
Gaps in stocks occur when a stock’s price jumps suddenly between two candlesticks, leaving behind a vertical gap in a chart. These gaps typically occur in response to after-hours news, but they can also result from a spurt of increased trading in the middle of a larger trend. Gaps often fill, but they don’t have to. It’s important for traders to correctly identify the type of gap they’re trading and to wait until a directional movement has formed before entering a trade.


