

Unusual options activity occurs when trading volume in an options contract is high above its average. This type of activity is often due to institutional investors and it can be a signal that smart money thinks the price of a stock will move soon. Keeping an eye on unusual options activity can help you generate trade ideas and stay one step ahead of the market.
In our guide to unusual options activity, we’ll explain what it is, why it’s important, and how you can track and generate trading ideas off of it.
Understanding the Options Market
In order to understand unusual options activity, it’s important to know a little about the options market. Stock options can be bullish (call options) or bearish (put options), and every option has an expiration date and strike price.
The expiration date is important because an options contract is worthless after that date. So, if a trader or institution wants to speculate on a price movement in a stock using options, they also have to decide when they think that price movement will occur.
The strike price is important because it represents the price at which an option contract can be exercised. It’s not the same as the breakeven price for an options trade, but it does play a role in determining whether an options trade is profitable. For a call option to make a profit, a stock’s price must be higher than the strike price before expiration. For a put option to make a profit, a stock’s price must be lower than the strike price before expiration.
A unique options contract is defined by its underlying stock, whether it is a call or put option, its expiration date, and its strike price. Each options contract has trading volume, which is measured as the number of contracts bought and sold in a single trading day.
What is Unusual Options Activity?
Unusual options activity is significantly higher than average trading volume in an options contract. Typically, unusual options activity is said to have occurred when trading volume in a contract is five times higher or greater than the average daily trading volume for that option.
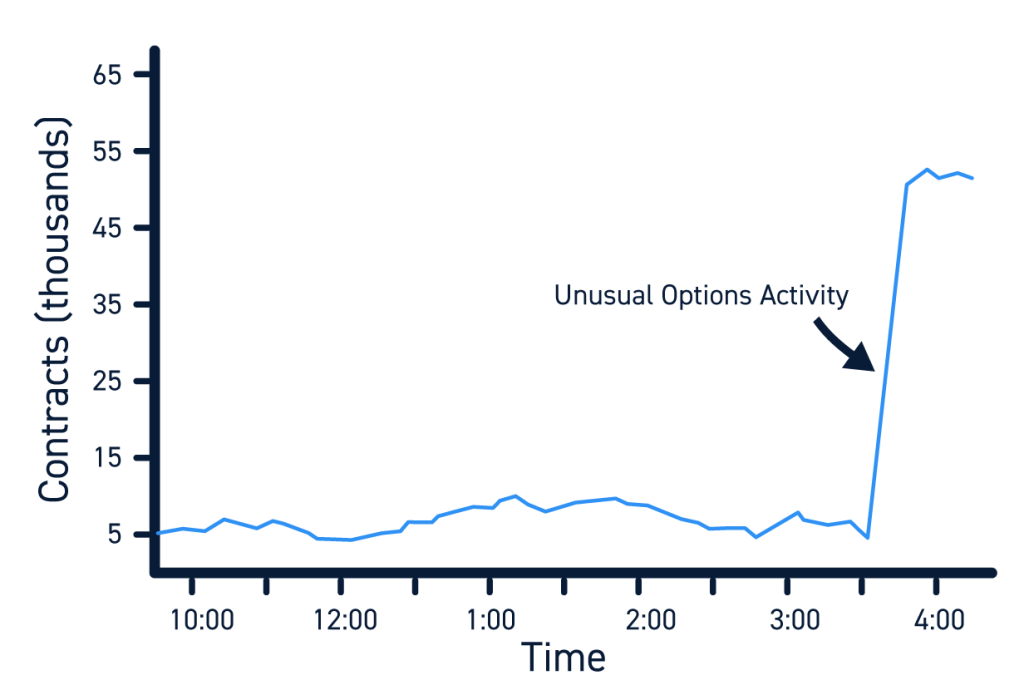
For example, say that 5,000 contracts of a call option on Apple are traded on an average day. Then in one day, 50,000 contracts of that option are purchased. This is 10 times the average trading volume and is considered unusual options activity.
Unusual options activity is also said to occur when the volume traded in an option on a single day exceeds the open interest in that option. Open interest represents the total number of active contracts that have not been sold or exercised.
Unusual options activity usually occurs in response to a catalyst, such as an earnings report, financial guidance, or an event that materially impacts a company’s stock. High trading volume in an options contract can be due to a single large institutional trade or it can be due to widespread interest in a stock as a result of news or other catalyst.
Why is Unusual Options Activity Worth Paying Attention To?
Unusual options activity is worth paying attention to because it signals unusually high interest in a stock. Higher than average trading volume in options contracts for a stock can occur even if trading volume for the stock’s shares is at or below average. So, the options market offers an alternative way to gauge market activity around a stock.
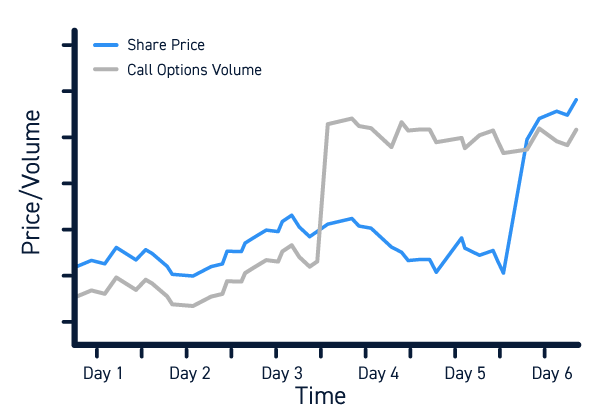
In addition, unusual options activity can allude to future price movements. Options contracts require traders to speculate not only on whether a stock’s price will move, but also when that movement will happen. So, watching unusual options activity can offer insight into whether traders think a move is coming in the near-term or in a few months’ time.
Unusual options activity is especially worth paying attention to when the bulk of the volume in a contract is driven by one or a few large trades. These very large trades typically represent institutional investors, who may have more information about a company than is available to retail traders. However, be cautious interpreting these trades as they can be a hedge or a part of a more complex options or overall trading strategy.
How to Track Unusual Options Activity
The simplest way to track unusual options activity is to use a free online scanner. There are many sites that keep real-time lists of contracts experiencing unusual options activity, and some even highlight large individual trades that may represent institutional activity.
You can also track unusual options activity on Twitter. Some accounts regularly share updates about unusual options activity, essentially putting the information out there for any trader to see.
For traders who want to craft more complex options trading strategies around this unusual activity, there are several premium scanners available. These scanners let you customize volume filters for what constitutes unusual activity as well as filter high-volume options trades based on how they are executed.
How to Trade Unusual Options Activity
It’s important to be cautious when trading unusual options activity. Although high volume in an options contract can suggest that a stock is about to move, it’s impossible to know the motivations behind trading. When volume is driven by one or a few large trades, it is possible that institutional investors are hedging against another trade. When volume is driven by many trades, it is possible that traders are piling onto unusual options activity or overreacting to news.
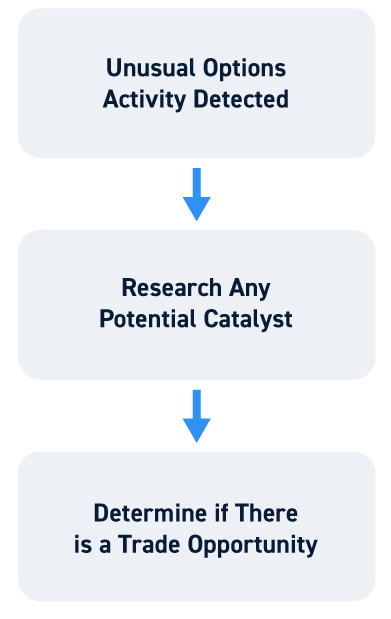
Traders should think of unusual options activity as a hit on a scanner. That means that unusual activity in a contract should not be considered enough of a reason to trade a stock on its own. Rather, it’s a starting point from which you can look for a catalyst and see if there’s a trading setup that fits your strategy.
Conclusion
Unusual options activity occurs when there is significantly higher than average trading volume in an options contract. Unusual options activity can be driven by widespread interest in a stock or by a few large trades placed by institutional traders. You can track unusual options activity using free or premium scanners. When monitoring unusual options activity, be sure to look for a catalyst and only trade if there is a setup that suits your trading strategy.


