

For traders, identifying key price levels ahead of time is part of the preparation that goes into developing a trading game plan. As they say, “Plan your trade and trade your plan.” While many traders do well enough with price charts and trend lines, active traders may want to add a momentum indicator to better gauge how price levels are achieved, which is the key to anticipating subsequent reactions.
What Are Stochastics?
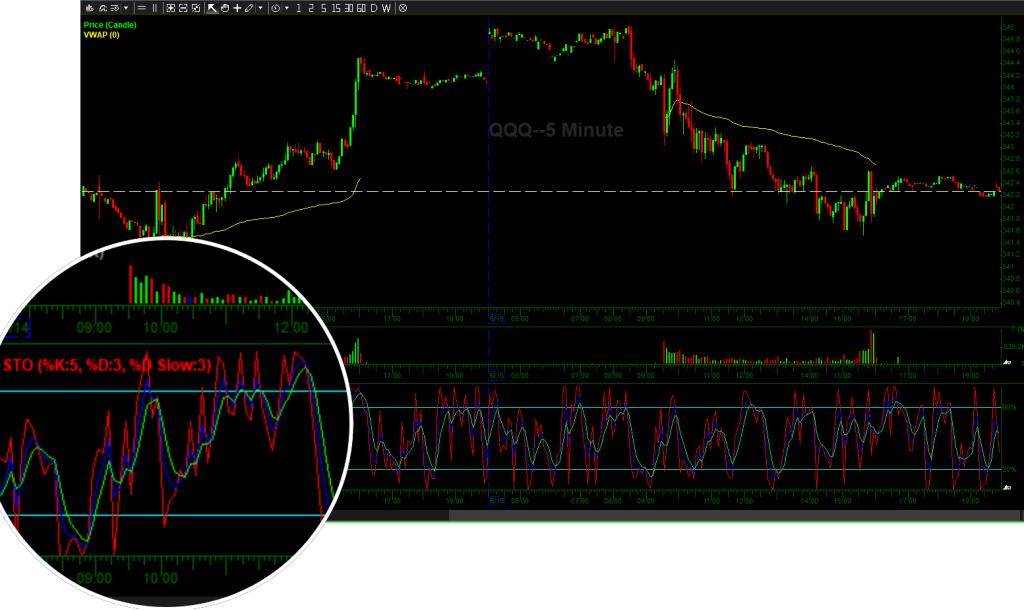
A stochastic oscillator is a technical charting indicator that enables users to gauge the momentum of the underlying price action. Very much like the tachometer you find in a car, it visually illustrates when prices are “overheating” to the upside (overbought) or to the downside (oversold).
While the term “stochastic” implies a single indicator, it is actually composed of two lines that oscillate together, composed of a lead oscillator (%K) and a laggard oscillation (%D).
The stochastic is plotted on a separate graph composed of the clock time on the X-axis and the “bands” from 0 to 100 on the Y-axis.
The 20-band and the 80-band on the y-axis are the oversold and overbought levels, respectively. When the stochastic oscillator (%K and %D) falls below the 20-band, it indicates that price is oversold. When the stochastic oscillator rises above the 80-band, it indicates that price is overbought.
Why Use Stochastics?
While price inflection points are important, how fast or slow the price is achieved can be just as important. Stocks that surge too fast can knee jerk traders to chase and overpay for entries. Stocks that fall to fast can cause traders to chase exits and panic out often times near the lows right before prices bounce.
How many times have you chased an entry only to have the price pull lower soon afterwards? The stochastic oscillator enables you to gauge when prices are in overbought or oversold mode to help you avoid chasing.
Delving deeper into this, it can enable you to sell into strength and buy into weakness, much like a market maker. This is especially handy when using a direct market access brokers (DMA) trading platform that enables commission rebates for providing liquidity. When used properly, stochastics can improve your timing and precision of entries and exits. At the very least, it can make you aware when you are chasing trades.
How to Use Stochastics
Stochastics can be used both as a defensive tool to prevent you from chasing entries and exits as well as an offensive tool for taking well timed entries and exits. The 20-band and 80-band are the key components to observe.
When price falls under the 20-band, the momentum is considered oversold. However, oversold stocks can remain oversold meaning prices can continue to go lower but the stochastic can only go to the zero band.
When stochastic crosses up through the 80-band, price is considered overbought. However, price can remain overbought and continue higher while the stochastic is above the 80-band.
20-Band Buy Triggers
The conventional buy trigger occurs not when the stochastic oscillations fall under the 20-band, but when they crossover back up through the 20-band. This is when the “engine” is refreshed as upward momentum returns causing the underlying prices to rise again.
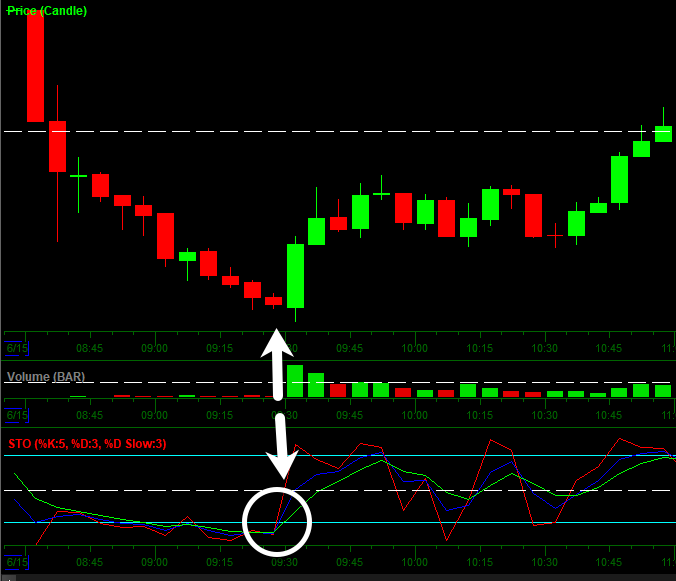
When stochastics fall under the 20-band, capitulation can form, allowing new buyers to get into the stock. Have you ever ‘thrown in the towel’ to stop out of a long position only to have the stock bounce back up after you got out? Chances are you stopped out as the stochastic fell under the 20-band (along with a lot of other traders).
Just being aware of this puts you in better control and enable you to time entries at more favorable prices. Keep in mind, the magnitude of the price rise is contingent on the context of the underlying price trend. This will involve adding a price indicator.
80-Band Sell Trigger
The 80-band is akin to the Earth’s atmosphere. When the stochastic rises through the 80-band, gravity dissipates as prices can continue to “melt-up”. However, when the stochastics fall back under the 80-band, gravity returns just as if a space ship was reentering the Earth’s atmosphere.
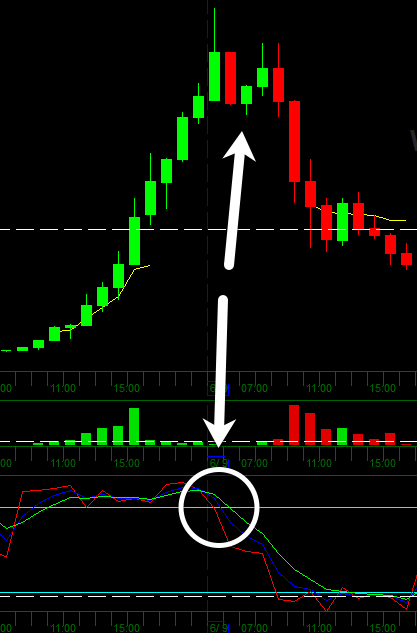
The conventional sell trigger occurs when the stochastic oscillator falls back under the 80-band. If you “chase” a long entry above the 80-band, be aware that the rug-pull occurs when the stochastic falls back under the 80-band. Knowing this should provide a heads up when the objective is to buy high and sell higher. Just make sure you are selling before the stochastic falls under the 80-band. If you are in a long position, utilize the 80-band as a profit stop loss to sell into strength and avoid selling into panic under the 20-band.
What Not to Use Stochastics For
One of the most common misconceptions about stochastics is the inconsistency when it comes to the underlying price moves. Stochastics measure the momentum and velocity of the underlying price moves. It doesn’t reflect the magnitude of the underlying price move.
For example, a stochastic may form a “full oscillation” move from the 20-band to the 80-band in the morning to generate a +$1.40 move, but then generate an identical full oscillation in the afternoon that only produces a + $0.58 underlying price move. Adding a complementary technical price indicator like moving averages can bridge the gap to better understand why stochastics generate larger price moves during price trends in the context of price support and resistance levels.
Improving the Efficiency of Stochastics
As with all technical indicators, the stochastic is a tool among many tools. It works best when used in conjunction with price indicator(s) as part of a complete trading methodology. Test the waters utilizing a combination of various price indicators like moving averages, Bollinger Bands and channels to find which suit your style and temperament the best. Stochastics are a complementary indicator that can improve price analysis to make more informed trading decisions.


