

Iceberg orders are a type of trade typically placed by institutional investors. They are designed to mask the size of an order, such that only a small portion of the total trade – the tip of the iceberg – is visible to the market. Traders who can recognize iceberg orders in real-time can potentially act on them to place profitable trades.
In this guide, we’ll explain what iceberg orders are, how they work, and how you can trade around them.
What is an Iceberg Order?
An iceberg order is a large buy or sell order that’s broken up into many smaller limit orders. Each limit order represents a fraction of the total trade and they are released to the market one at a time. Once the first limit order is filled, the next in the sequence is released, and so on. This ensures that only one active order is visible to the market at a time in Level 2 data.
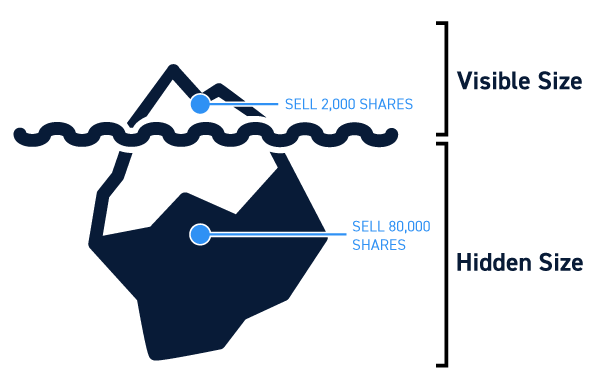
Iceberg orders are typically used by institutional investors to mask the size of a large trade. Hiding the size of a trade is important because large trades can disrupt the market and prevent institutional investors from getting the best prices for their purchase or sale.
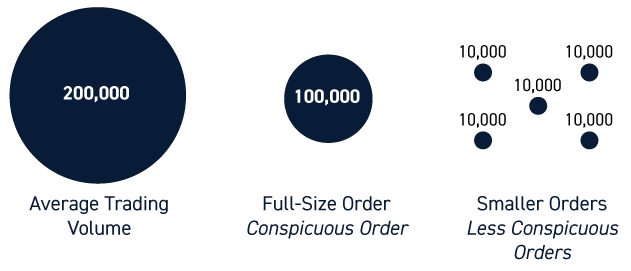
For example, if an institutional investor enters a buy order that far exceeds the daily trading volume in a stock, traders are likely to notice that and to bid up the price before the whole order can be filled. On the other hand, if a fund wants to completely liquidate its position in a stock, a single large order could induce panic and drive the price sharply downward. The smaller individual trades that make up an iceberg order are much less likely to be noticed by traders, as well as leave traders who do notice uncertain about what the total order size may be.
Iceberg Order Example
To better understand how iceberg orders work, let’s look at an example. Say an investment firm wants to buy 100,000 shares of company XYZ, which has an average daily trading volume of 50,000 shares. Such a large order is likely to be noticed by traders, so the company splits the total trade into 10 limit orders for 10,000 shares each.
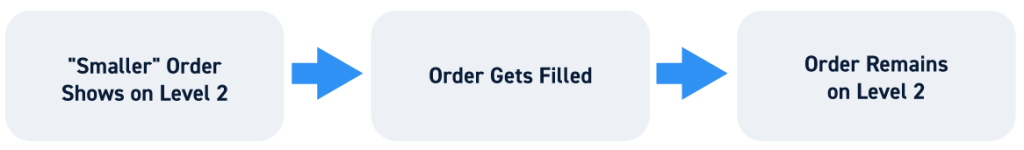
The first order is entered into the market, becoming visible to traders in Level 2 data. Once it’s fulfilled, the next order for 10,000 more shares is automatically released to the market. This continues one order at a time until all 10 orders are filled.
For traders watching this happen, such an iceberg order would appear as identical trades for 10,000 shares repeatedly entering the market, one at a time. The trades are likely to come from the same market maker.
How to Identify Iceberg Orders
The best way for traders to identify iceberg orders in real-time is to monitor Level 2 data and time and sales data. Level 2 data provides information about the current order book for a stock, while time and sales provides information about executed trades.
Iceberg orders appear as a series of identical trades that may be large in volume hitting these data feeds in a sequence, one after another. Importantly, Level 2 data and time and sales may display different total volumes. For example, if there is an order for 10,000 shares on the Level 2 feed, but an order for 100,000 shares appears in the time and sales feed, it may be an iceberg order similar to the one in the example above.
Why Do Iceberg Orders Matter?
Iceberg orders matter because they make it more difficult for day traders to trade around large institutional buy and sell orders that can move the price of a stock. In the absence of iceberg orders, traders could easily spot large orders from institutional investors and act accordingly. For example, traders could bid up the price of a stock following a large buy order hitting the market and then sell quickly knowing that the institutional investor’s order has yet to be completely filled.
Thanks to iceberg orders, it’s difficult to know that an institutional investor is executing a large order, and even more difficult to guess how big that order might be. So, traders who might try to bid up the price of a stock take on more risk because they don’t know how much more volume remains to be filled.
How to Factor Iceberg Orders into Your Trading
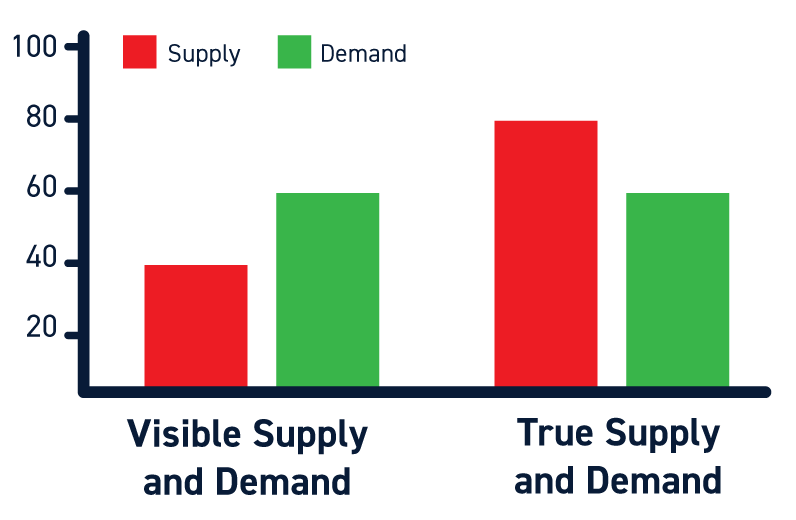
Although iceberg orders are more difficult to trade than unmasked orders, traders can still take them into account when trading. If you recognize an iceberg order as it’s happening, you can trade based on the hidden supply or demand represented by the order. The only catch is that you will not know how much volume is still to come, so it’s important to be cautious when buying or selling in response to an iceberg order.
More broadly, the price level at which an iceberg order is executed often serves as a support or resistance level for a stock going forward. These support and resistance levels can be combined with other technical indicators to enable a wide range of trading strategies. So, traders can benefit from recognizing iceberg orders even after they have been fully executed.
Conclusion
Institutional investors use iceberg orders to mask the size of large trades that could move the market before their order is completely filled. For traders, iceberg orders make it more difficult to identify large institutional purchases and sales.
Traders can identity iceberg orders using Level 2 and time and sales data, and can trade around these orders with caution to try to make a quick profit. Traders can also monitor these orders to identify support and resistance levels that may be important information going forward.


