

Time and sales is a running display of all trades executed for a particular stock. It is often used by traders as a way to gauge activity around a particular stock and to find potential entry and exit points.
In this guide, we’ll explain what time and sales is and how traders can use this data to their advantage.
What is Time and Sales?
Time and sales is the digital version of the traditional stock ticker tape. It is a real-time data feed of every trade happening on an exchange for a particular security. Most day trading platforms include a time and sales feed.
Components of Time and Sales
Each trade displayed on a time and sales feed is called a print. The print has 3 components: time, price, and volume.
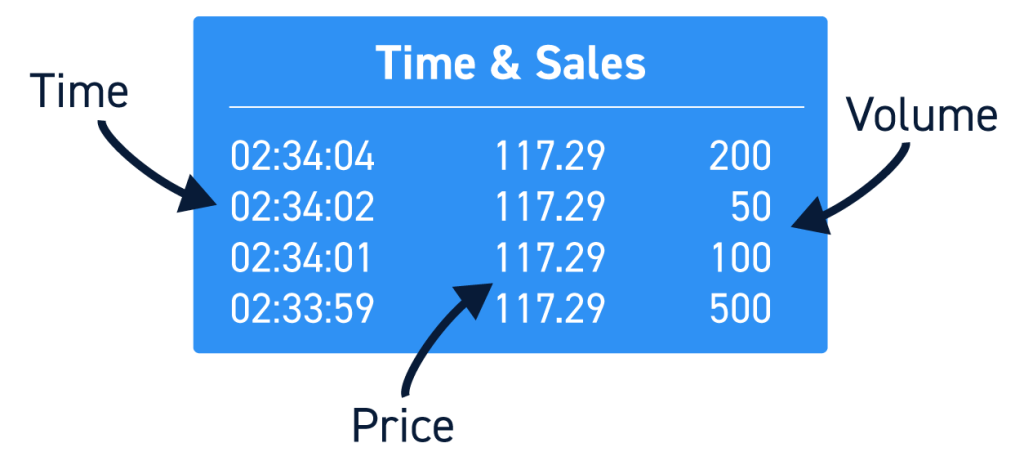
The time column shows the exact time – down to the second – that a trade was executed. The price column shows the execution price, and the volume column shows the number of shares that were traded.
In many trading platforms, the price component of time and sales feed are color-coded. Green text indicates that a stock was bought at the ask price – a bullish indicator since buyers are paying the full spread to purchase a stock. Red text indicates that a stock was bought at the bid price – a bearish indicator since sellers are paying the full spread to sell a stock. Trades that occur between the bid and ask prices are displayed in white text. Some trades executed outside of market hours or matched between firms outside of an exchange are called irregular prints and are usually reflected in another color. Irregular prints occur much less often than the 3 common types.
Time and Sales vs. Level 2
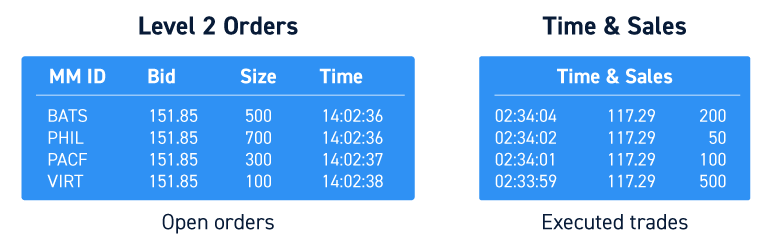
Level 2 and time and sales both offer real-time feeds of exchange data, and they look somewhat similar. However, these two data feeds report different things.
Level 2 data displays open orders. It shows the best bid and best ask price available for a specific stock based on all current bid and ask offers currently on the exchange. It does not provide information about whether these bid and ask offers have been matched in a trade.
Time and sales data displays executed trades. It shows the exact price at which a trade was made, and color-coding is used to indicate whether the trade took place at the bid, ask, or in between. While time and sales provides information about the latest execution price for a stock, it does not provide information about the bid and ask prices available after the latest trade.
Why is Time and Sales Important for Traders?
Time and sales data can be used by traders in several different ways.
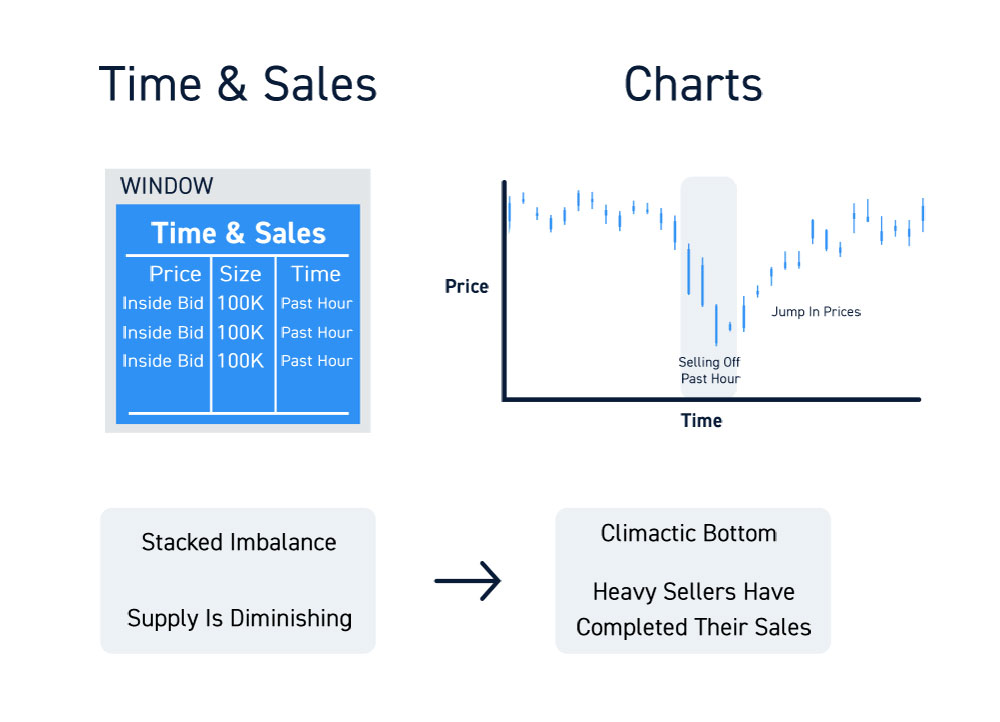
First, it’s useful for gauging supply and demand for a stock in real-time. If several trades in a row are executed at the ask price (displayed in green on most trading platforms), that’s a sign that demand for the stock is relatively high. If several trades in a row are executed at the bid price (displayed in red), that’s a sign that demand is low relative to supply.
The speed of transactions in the time and sales feed can also be telling. A sudden flurry of orders usually indicates that demand for a stock has changed, and a price change could soon follow.
Second, time and sales data can enable traders to spot unusual trades, such as block orders. In many trading platforms, you can sort or filter the time and sales feed by trade size, making it easy to find the day’s largest trades. If you are monitoring the time and sales feed for a particular stock and see an order for tens of thousands of shares appear, that’s typically a sign of institutional buying or selling activity.
Finally, time and sales data provides additional context for Level 2 data. When monitoring both Level 2 and time and sales feeds, you can see in real-time how open bid and ask offers are being translated into executed trades. Monitoring both feeds together offers savvy traders an opportunity to spot small shifts in supply and demand as soon as they happen.
Conclusion
Time and sales data provides traders with a feed of all trades that are executed in a particular stock. Monitoring time and sales can help you gauge supply and demand, allow you to quickly spot block trades, and provide additional context for Level 2 market data. Most day trading platforms offer time and sales feeds as well as filters to help you incorporate this data into your trading strategy.


