

Typically, you might think about a stock as having a single price at any given time. But in reality, a stock has two prices: the price that you can sell it for and the price you can buy it for.
The difference between these two prices is a stock’s spread, and it’s an important figure for traders to be aware of. In this guide, we’ll explain exactly what a stock’s spread is and why you should pay attention to spreads.
What Are Bid and Ask Prices?
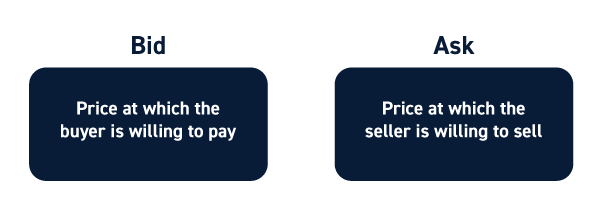
At any given time, a stock has two prices: the bid price and the ask price. The bid price is the highest price a buyer is willing to pay for a share, while the ask price is the lowest price at which a seller is willing sell a share.
The ask price is always equal to or higher than the bid price. When traders want to buy a stock, they pay the higher ask price. When traders want to sell a stock, they receive the lower bid price.
Bid and ask prices are set by participants in the market. If demand outstrips supply, bid and ask prices will go up. If there’s more supply of a stock than demand to buy it, bid and ask prices will fall.
What is a Stock’s Spread?
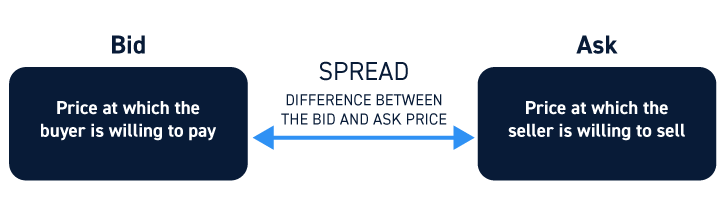
A stock’s spread is the difference between its bid and ask prices. Say a stock has a bid price of $10.00 and an ask price of $10.05 per share. In that case, the spread would be $0.05.
The spread goes to the market maker, who is responsible for pairing buy and sell orders in the stock market. While bid and ask prices are set by the market, market makers determine a stock’s spread.
Spreads are generally kept low by competition among market makers. However, market makers increase their spreads for a particular stock when they believe that the risk of buying and selling that stock is higher. For example, if fast-moving prices mean that a market maker could lose money on a trade, they are likely to charge a higher spread for taking on that risk.
Why Pay Attention to a Stock’s Spread?
Traders should pay close attention to a stock’s spread because it provides important information about the current state of the market for that stock.
Liquidity
One of the most important things traders can learn from a stock’s spread is whether that stock trades with high or low liquidity. When a stock has high liquidity, supply and demand are both high. Market makers can complete transactions without moving the market too much, so their risk in transacting any trade is relatively low. As a result, market makers charge relatively low spreads.
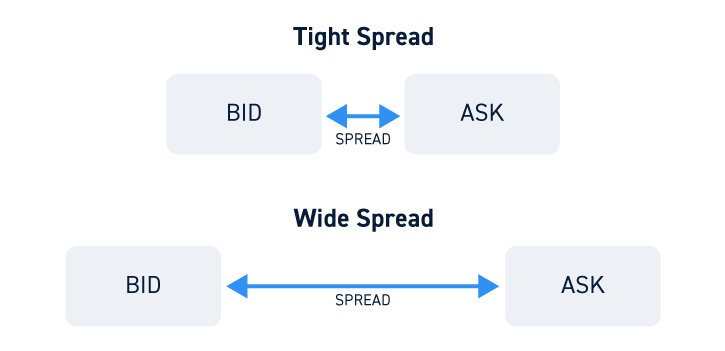
As liquidity declines, market makers face a greater risk that they will move the market by completing a trade. As a result, they charge higher spreads. So, wide spreads – around $0.10 or more – are an indication that a stock has low liquidity.
Volatility
Volatility also influences the spreads that market makers charge. A stock trading with high volatility experiences frequent and high-magnitude price swings. These swings increase market makers’ risk because the price could change while a transaction is being executed.
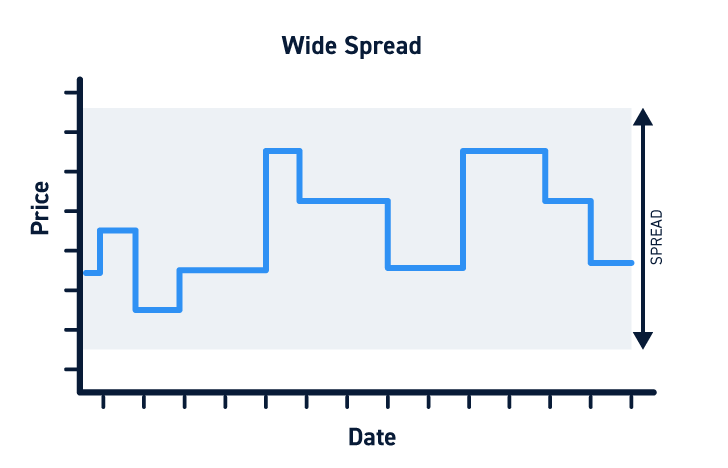
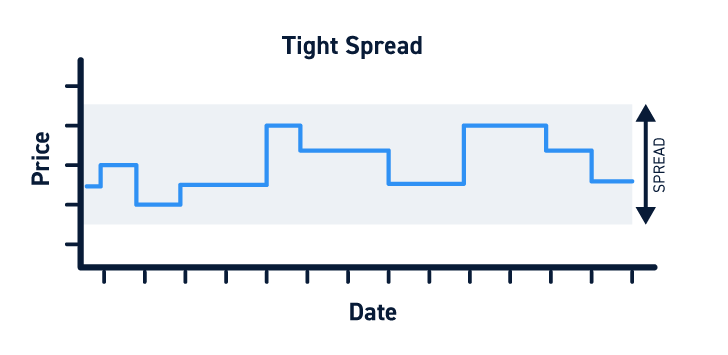
So, stocks with high volatility often trade with higher spreads. Stocks with low volatility have tighter spreads.
Order Execution
Traders also need to be aware of the cost that spreads incur. Say a trader buys a stock with a $0.10 spread and then sells it immediately. Even if the bid and ask prices didn’t change, the trade would lose $0.10 per share.
Wider spreads incur bigger built-in trading costs. For example, to break even on a trade with a $0.10 spread, traders would need the bid price to rise by at least $0.10 before they sell. If the spread for the same stock were only $0.02, traders would only need the bid price to rise by $0.02 to break even on their trade.
For a stock that costs $10, that’s the difference between a 1% price movement and a 0.2% price movement!
Supply & Demand
Traders can also study spreads to determine whether supply and demand for a particular stock are balanced. When supply greatly exceeds demand or vice versa, market makers take on greater risk when acting as intermediaries for a trade. As a result, spreads widen when supply and demand are imbalanced.
Traders can check Level 2 market data to determine whether buyers (demand) or sellers (supply) are in control of the market for a stock.
Conclusion
A stock’s spread is the difference between its bid and ask prices. Spreads are determined by market makers in response to how risky it is to create a market for a particular stock.
Traders should pay attention to spreads because they offer insight into the market for a stock. When liquidity is low, volatility is high, or supply and demand are imbalanced, a stock’s spread widens and traders pay more to execute a trade.


