

While you may be familiar with U.S. stock markets, the reality is that all global financial markets are interconnected either directly or indirectly. Some of the relationships are more familiar like the inverse relationship between stocks and bonds. Some relationships may seem completely unrelated like the municipal bond markets and gold prices. However, every financial market is connected even if they are directly correlated.
Everything is Interconnected
Financial markets are the equivalent of the waterways of this planet – from oceans to rivers to lakes to creeks, they are all interconnected. Due to the globalization of commerce and ease of access to financial markets, the degree of interconnectedness is great than ever.
While a direct relationship may not be apparent, it’s the ripple effects from a small market disruption can transcend into different asset classes and financial markets that can trigger larger risk events leading to systemic risk affecting literally all economies. The relationships may not be apparent until a systemic risk or black swan event triggers like in 1997.
The 1997 Pacific Rim Financial Crisis
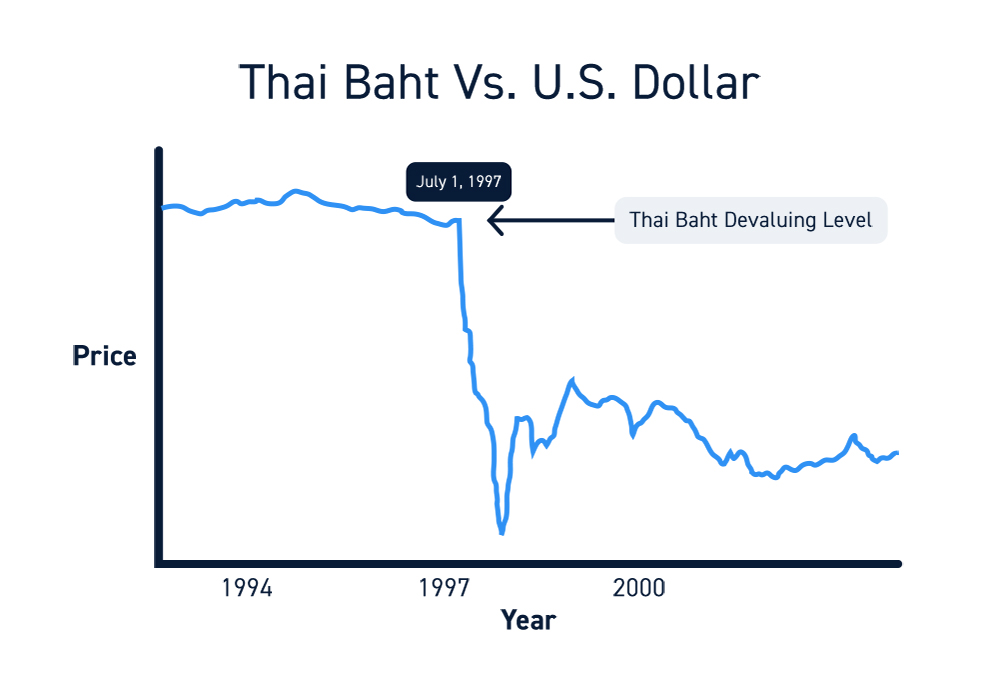
On July 1, 1997, the central bank of Thailand shocked Asian currency markets by devaluing the Thai baht despite previously denying their intent to do so. This caused a chain reaction of falling stock markets and asset price devaluations as private debt exploded throughout Asian markets from South Korea, Philippines, Laos, Malaysia to Singapore, Taiwan, Vietnam, Indonesia to Japan, Hong Kong and even mainland China.
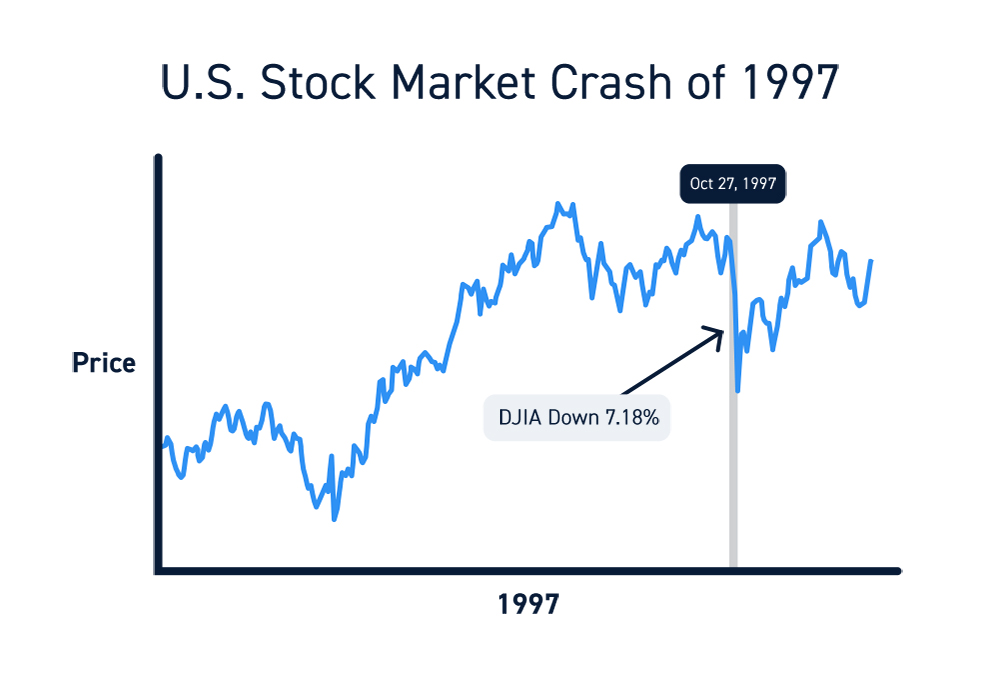
The disruption in Asian markets eventually lead to the infamous U.S. Stock Market Crash of 1997. The Dow Jones Industrial Average experienced the biggest point drop in history (at that point) as it plunged (-554) points, down 7.18%, bypassing exchange circuit breakers on Oct. 27, 1997. This is a very significant example of how an unrelated (nor correlated) financial market resonated a “butterfly effect” eventually leading to a U.S. stock market crash four months later.
Global Economy
Economies and financial markets are more interconnected now than ever due to the expansion of trade, cross border commerce, access and engagement to financial markets and trading. While this connection has global benefits, it can also enable minor disruptions to compound into larger scale crisis situations.
The markets exist at massive scales with an ever-increasing number of moving parts. This further proliferates perpetual price discovery through “equilibrium-seeking” systems. For example, a 10% jump in the price of milk may not affect your behavior as a consumer but can have larger global implications on demand and supply chain disruptions.
The Butterfly Effect
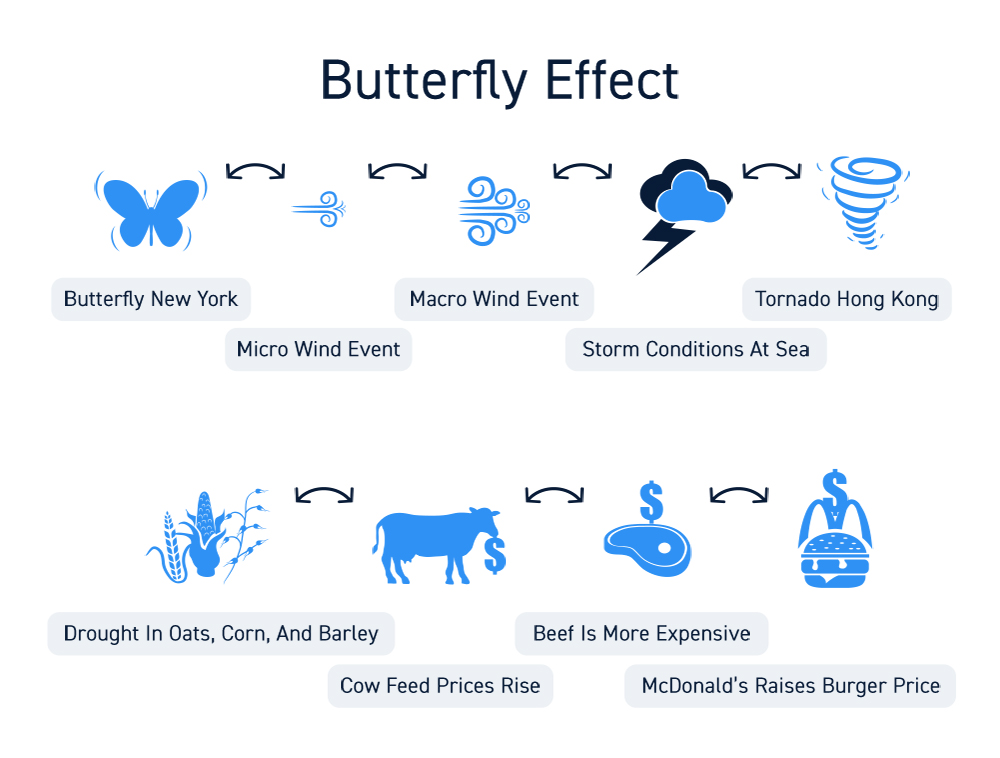
A seemingly insignificant situation or change can lead to a series of compounding events resulting in a much larger and seemingly unrelated catastrophe elsewhere down the road. The “butterfly effect” depicts a situation where a butterfly flaps its wings in New York causing a tornado to materialize in Hong Kong.
The devaluing of Thailand’s currency culminated into triggering the U.S. stock market crash of 1997 destroying $663 billion in market capitalization in a single day. This applies throughout all facets of financial markets and asset classes with an invisible but material trickle down effect. Small changes lend to larger effects. For example, a drought in oats, corn, and barley causes cow feed prices to rise making beef more expensive leads to McDonald’s raising prices on their burgers.
Supply and Demand
The principle of supply and demand is common in all markets. When demand overwhelms supply, prices rise. When supply overwhelms demand, prices fall. However, there is a third less understood axiom.
Price alone can impact the perception of demand and supply. For example, when prices spike, it immediately implies that demand is greater than supply. When prices collapse, it implies supply is greater than demand. This “artificial” manipulation or “gamesmanship” of price is an age-old factor that is overlooked throughout financial markets.
Supply and demand dynamics impact price, but price alone can impact the perception of supply and demand. The artificial gamesmanship of price can change the complete playing field just as buying begets more buying and selling begets more selling. Price can be a self-fulfilling prophecy that continues to grind until the narrative is changed and in turn sentiment as well. This is why traders monitor price action to anchor supply and demand and news often times gets “curve fit” to explain the price action.
Types of Correlations
Financial markets tend to correlate both positively and negatively with other markets. These relationships are the foundation of market dynamics. It’s important to understand the types of correlations first and foremost in orders to distinguish when a divergence starts to enter the picture. It’s usually the divergences that signal an impending disruption leading to an anomaly situation and systemic risk.
Positive Correlation
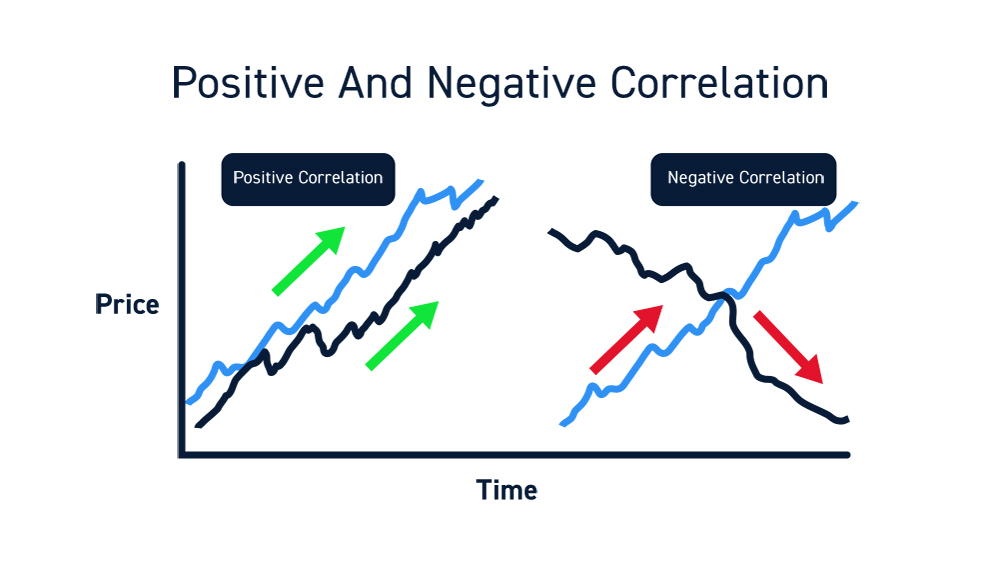
When a market or financial instrument moves parallel to and with another market or financial instrument, it has a positive correlation. Stocks in the financial sector tend to be positively correlated with each other and the S&P 500. This even applies to products and services. For example, if smartphone sales rise then app purchases tend to follow as well.
Negative Correlation
The opposite of a positive correlation is an inverse relationship known as negative correlation – when one goes up the other does down. A common example is stock markets are negatively correlated with bond markets, or stocks and bonds. When stocks rise, bonds fall representing a “risk on” sentiment and vice versa. The explanation is simple enough – money is looking for returns during rising stock markets and flow into stocks. In falling markets, risk off sentiment seeks safety in fixed income assets as money flows into bonds.
Interconnected Markets and Factors
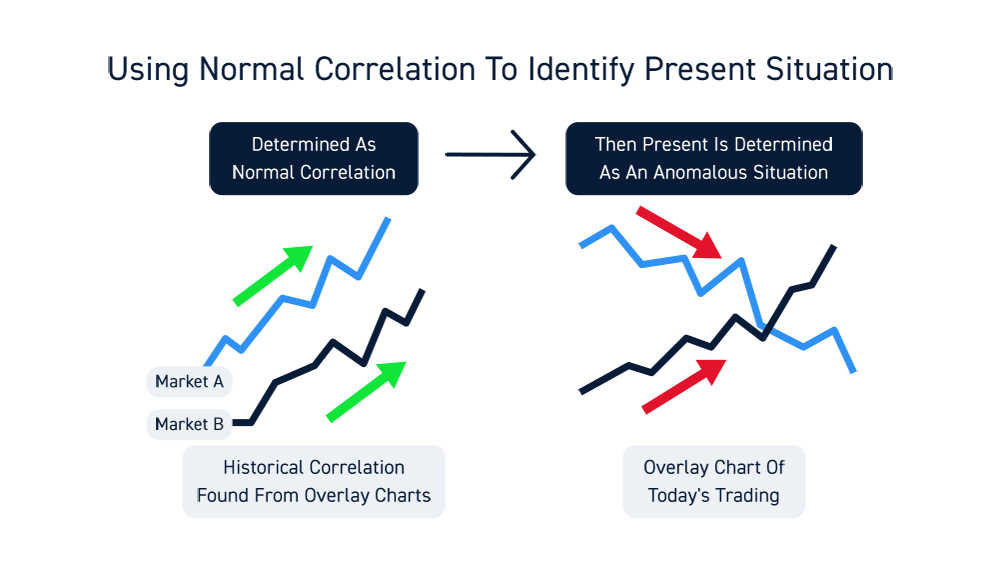
Normally markets are interconnected through the various positive and negative correlated instruments. It’s important to be aware of what is the ‘normal’ correlation in order to identify when an anomalous situation is forming. Each asset class has a relationship within their markets as well as with other markets. It’s the degree of correlation that may fluctuate. It’s best to overlay charts of each market to visually gauge the periods of positive and negative correlations.
Global Markets
The U.S. equities markets anchored by the S&P 500 futures tends to be the standard anchor that takes the lead with most global stock markets. If the S&P 500 index spikes sharply, then European markets tend to rise as indicated by the FTSE.
The U.S. and European stock markets are positively correlated. Strength from the S&P 500 tends to flow into the Asian markets lead by Japan’s Nikkei and South Korea’s KOSPI. Chinese market indexes Hang Seng and Hong Kong tend to fluctuate between positive and negative correlations with the rest of Asia and the U.S. When a very common and conventional linked correlation starts to unwind, it can cause periods of uncertainty due to the decoupling.
Stocks
All stock markets are composed of sectors and industries. Stocks within the sectors tend have positive correlation most of the times, but negative correlation can also form between competing peers. Amongst the sectors, “risk-on” sectors like information technology and communications stocks tend to have negative correlation with “risk-off” sectors like utilities and real estate, but not all the time. In a very strong rising stock market, all sectors can rise together but the magnitude of the rise can vary.
Gold
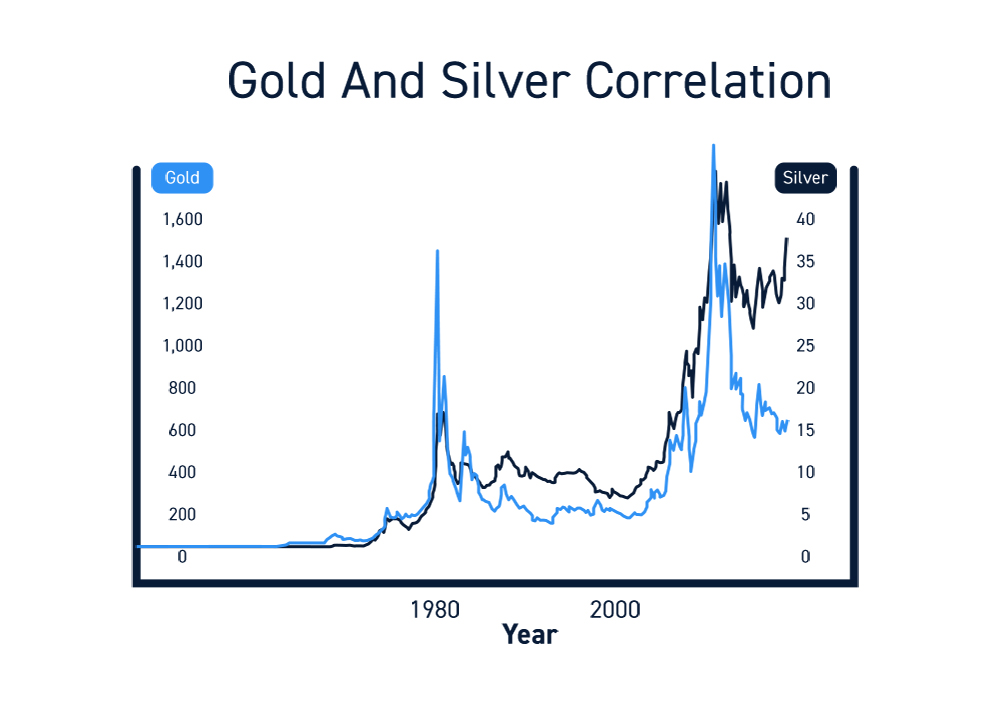
The advent of ETFs enable more participants to play commodities which also result in more volatility in price and correlation. Gold is seen as a safety hedge during volatile markets, inflation and economic uncertainty. This tends to generate an inverse correlation with stock markets, but this can fluctuate when the narrative focuses on rising asset prices across the spectrum. Silver tends to correlate positively with gold.
Oil
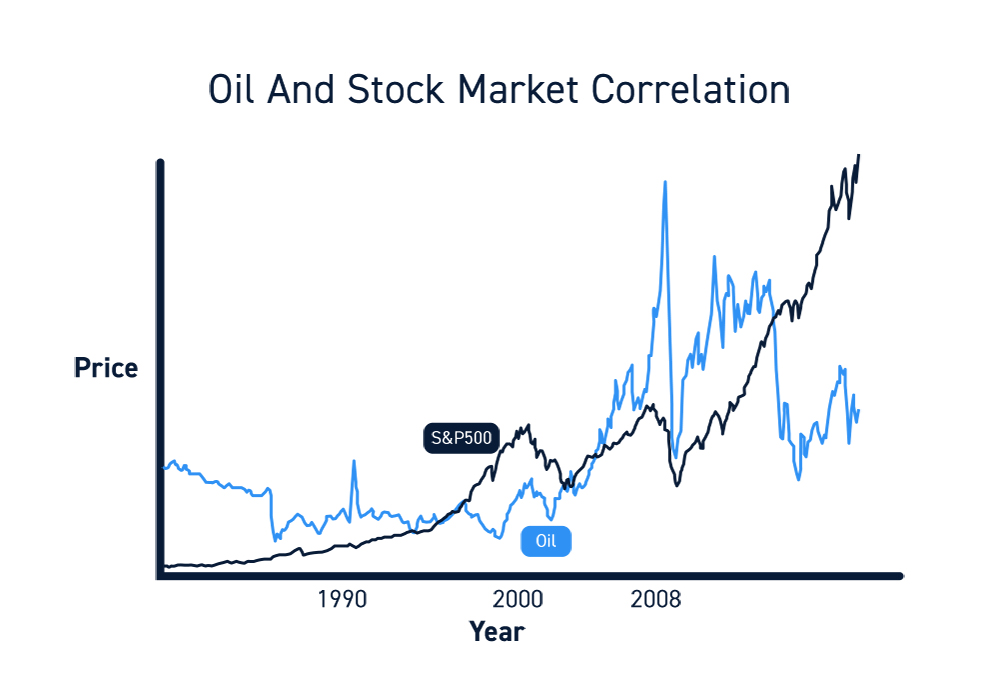
Oil is an energy commodity. The conventional thinking is rising oil prices are bad for stock markets producing a negative correlation. However, charts show that’s not always the case as oil prices and stocks have gone through periods of positive and negative correlation. Higher oil prices mean shrinking margins for transports; therefore, a negative correlation exists between crude oil and airlines and cruise ships and automobile manufacturers.
Natural Gas
Just like oil, natural gas is an energy commodity. Natural gas tends to have positive correlation with crude oil, but periods of negative correlation also creep in notably during the summer months.

Agricultural Commodities
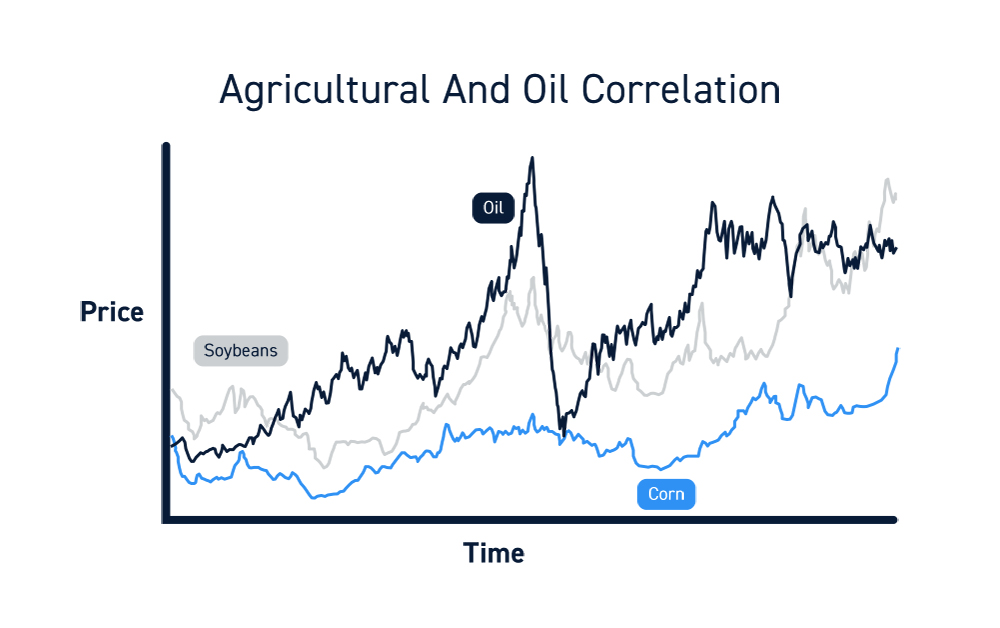
Sugar, corn, soybeans and wheat are examples of agricultural commodities, which are utilized as a hedge against inflation. In addition to the futures contracts, they can also be traded with ETFs. Generally ag commodities tend to correlate with oil prices.
U.S. Federal Reserve Interest Policy
The U.S. Federal Reserve (Fed) is the most powerful and influential central bank in the world. They set interest rate policy controlling the flow of money, which is usually followed by other central banks throughout the world.
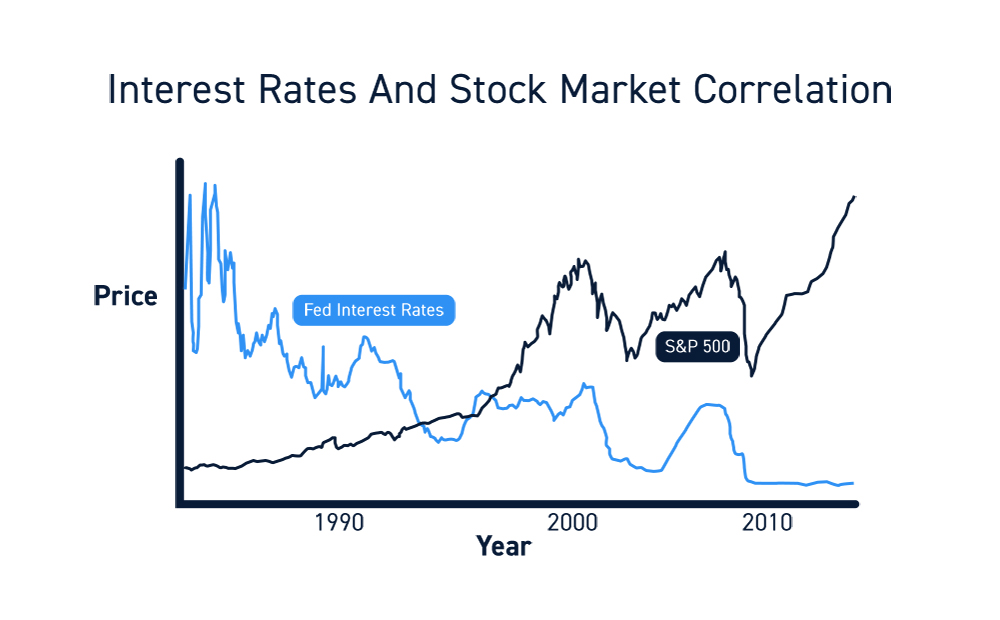
The Fed provides liquidity and monitors inflation and deflation scenarios. They walk the tightrope knowing the ripple effects of their actions reverberate globally. When they raise interest rates, money flow races into bonds and fixed income as it leaves stocks and vice versa when rates are cut.
This is the traditional correlation – rising interest rates mean lower stock markets. However, this is not always the case. Since the Fed started its monetary tightening policy raising interest rates and winding down it’s balance sheet, the U.S. equities market continued to rise. Pundits argue the decoupling is a result of the unprecedented amount of artificial intervention that the Fed and global central banks have partaken since the 2008 financial meltdown. When the Fed speaks, the world listens. Their statements alone are analyzed word for word to spot any potential changes in sentiment. They are the most impactful body in the world as global central banks tend to fall in line with the Fed.
Putting it All Together
A simple example of correlations is when the Fed cuts interest rates, stock markets rally, and bond markets fall. During the global financial meltdown, the Fed implemented a zero-interest rate policy (ZIRP) combined with quantitative easing (QE) in November2008. This action was mirrored by the European Central Bank (ECB) followed by most of the world’s central banks to provide liquidity and backstop economies from collapse setting the narrative for the recovery.
If a major airline stock collapses on rumors swirling around a missed interest payment and potential for bankruptcy, this will cause all airlines to collapse in valuation on positive correlation. As individual airlines provide transparency on their financial situation and provide improved outlooks, negative correlation forms on these individual airlines that exhibit stability as their values rise while others continue to drop. When the original major airline provides an update on recent financing that shores up the balance sheet to last two more years and raises outlook. The positive correlation pulls up the whole sector higher including the smaller competitors and bolsters the leading stocks that already updated their outlooks. This move can also pull up the whole transportation sector as sentiment improves thereby pulling up the S&P 500 higher which pulls up the rest of the sectors. This can cause the European FTSE 100 index to rise mirroring the S&P 500, which leads to Asian markets to rise.
In summary, correlations are everywhere. If you are speculating on broader market trends and company performance, it can be helpful to think about the factors that may indirectly impact your predictions.


