What is a Trend Reversal?
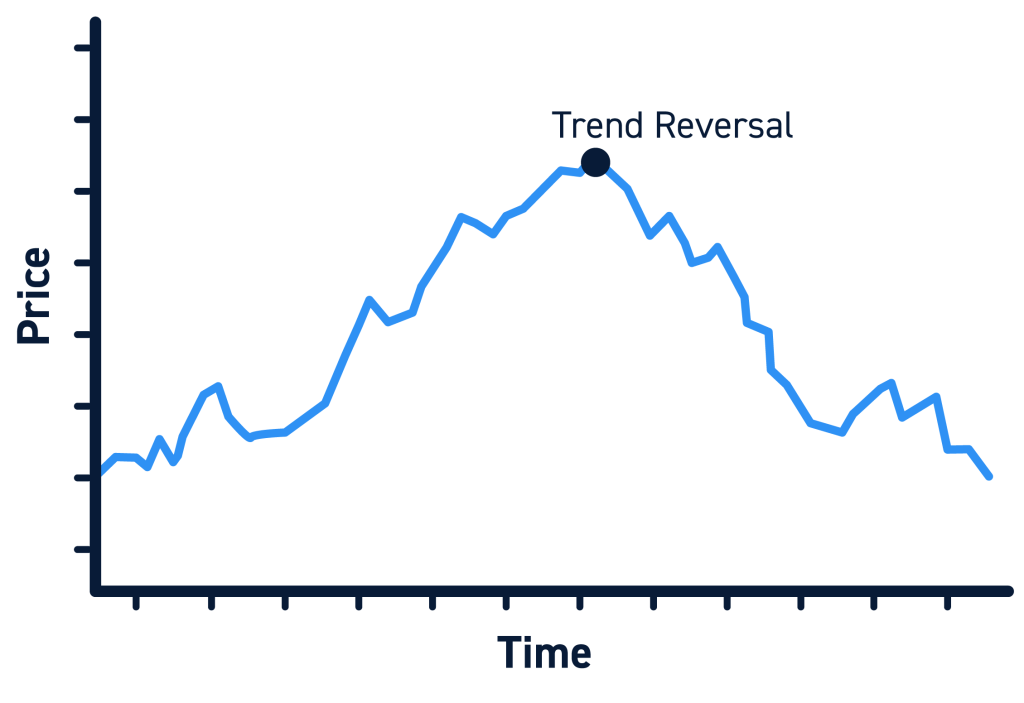
A trend reversal is simply a change in the direction of a stock’s price trend. In layman’s terms, the asset’s price moves in the opposite direction, signaling the end of a downtrend and the start of an uptrend, or vice versa.
As would be expected, being able to identify trend reversals is essential to planning reversal trades, whether that’s entering a buy at the bottom of a trend, entering a sell at the top, or exiting open positions at the trend high/low.
There is a wide range of patterns and indicators that can help traders effectively execute trend reversals in any given financial market. We’ll be detailing some of the most popular methods in hopes they can assist you in your own day trading.
No Reversal Pattern is for Certain
Properly identifying a stock trend reversal can be very profitable, as reversals frequently present enticing risk-to-reward opportunities, but it’s important to keep in mind that trend reversals can never be identified with 100% confidence (wouldn’t’t that be nice?).
While there are tools that can be used to identify areas where a trend reversal is more probable, it is ultimately up to the trader to make a decision based on their own analysis.
Additionally, it is often safer for traders to join trends rather than trying to catch reversals. As such, it is important to remain cautious of price movements against you when entering a reversal.
Every trader should have a well-defined stop point, whether it is a hard stop or a mental one, when trading trend reversals. That stop-loss should also be at the point where your “reversal” thesis is negated, wherever that may be according to your analysis or indicators of choice.
With that said, let’s dive into some of the most popular ways traders identify trend reversals.
4 Ways to Identify Trend Reversals:
Below are a few methods you can use to identify potential trend reversal setups.
Trendline Reversals:
Drawing a trendline on the chart with a timeframe relevant to your trading is one of the most common ways traders identify and trade trend reversals.
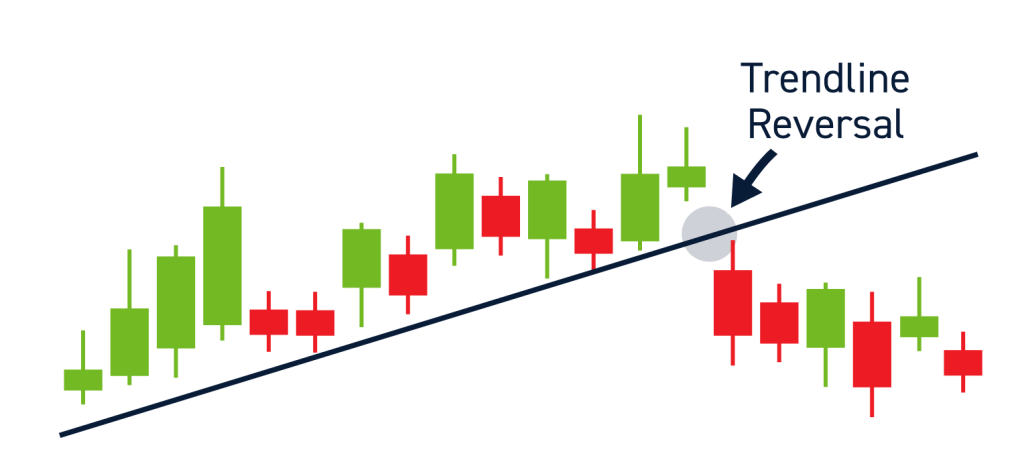
Trend lines are straight lines that indicate the general direction of a stock’s price. They can be used on any chart timeframe (i.e. 5-minute, daily, weekly, etc.).
A break of a trendline may indicate a new trend is beginning, while finding support on the trendline may indicate a continuation of a trend.
To identify a trend reversal using trendlines, start by drawing a trendline on a chart that is relevant to your trading style. Swing traders may analyze trends on daily or hourly charts, whereas intraday traders may analyze trends on 1 or 5-minute charts.
Like most things in trading, drawing trendlines is not an exact science, but there are some general guidelines. Trendlines should connect a stock’s highs (in a downtrend) or lows (in an uptrend). Trendlines should have two or more touchpoints. The more times a stock bounces of a trendline (touchpoints), the more significant that trendline may be.
When a stock breaks above or below a significant trendline, a trend reversal may be occurring. Keep in mind that trendlines may not be exact, and stocks may spike above or below a significant trendline before returning to their trend. When searching for trend reversals, you should look for a convincing break of the trendline (more on this later).
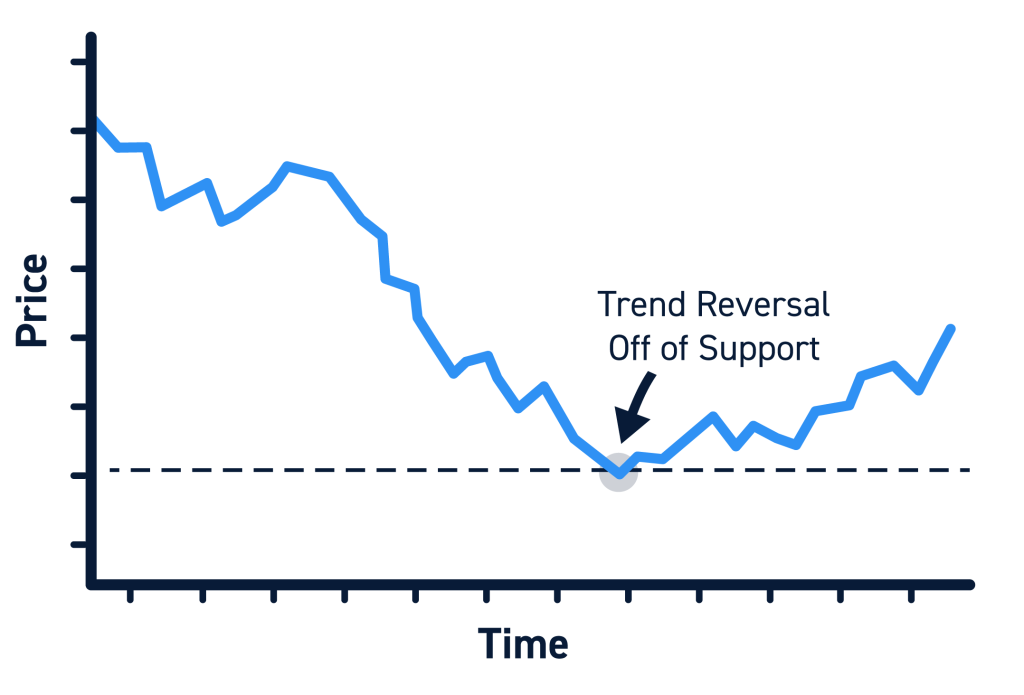
Trend Reversals at Key Price Levels:
Stocks often reverse at key support and resistance levels. These may include psychological levels (ex: $100) or previous highs/lows that can be identified by analyzing the chart (i.e. support and resistance levels).
Like trendlines, the more touchpoints at a support/resistance level, the more significant that level may be.
For example, assume a stock has dropped from $50 to $30 and you are trying to identify a potential reversal point. You look left on the chart and notice that the stock has bounced off of the $25 price level 4 times in the past year. This may be a significant area of support that can serve as the foundation for a reversal trade thesis.
Of course, nothing is guaranteed, so traders should still exercise diligence and keep tight stops.
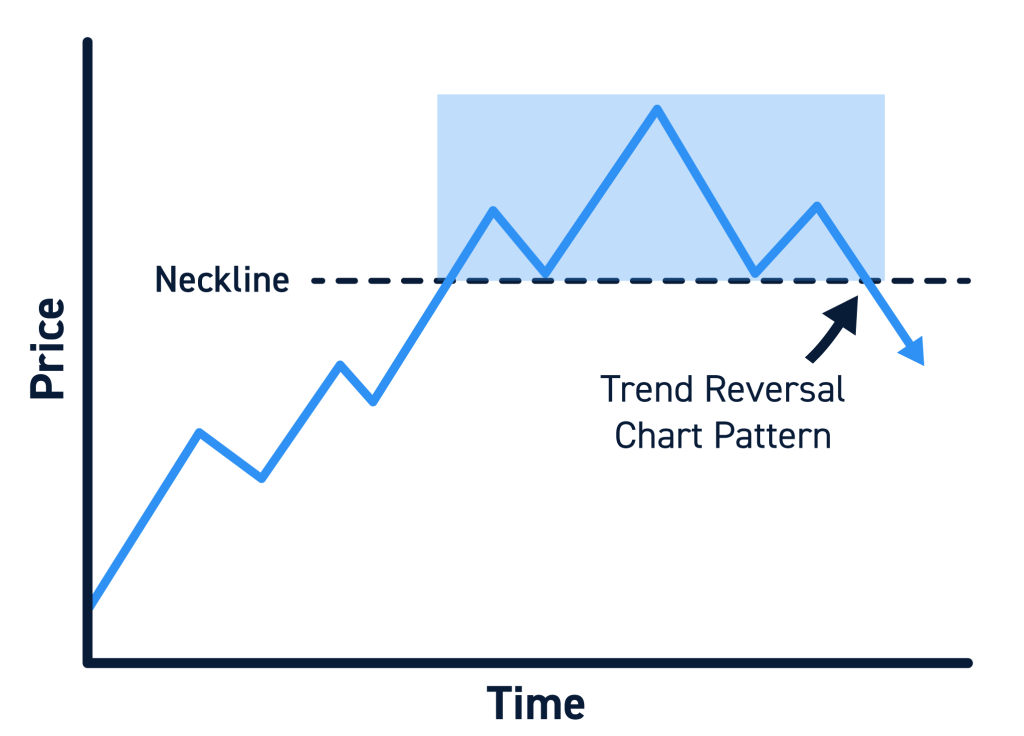
Trend Reversal Chart Patterns:
Certain chart patterns may also indicate a trend reversal. These patterns form over time and may allude to future price action such as a reversal.
For example, the head and shoulders pattern forms a peak, followed by a higher peak, followed by a lower peak, and, finally, a breakout through the neckline, which indicates a bearish trend reversal.
Familiarizing yourself with reversal chart patterns can help you identify inflection points that may not be clear when simply analyzing trendlines or support/resistance levels.
Popular reversal patterns include:
- Head and Shoulder Patterns
- Double/Triple Tops & Bottoms
- Wedge Patterns
Trend Reversal Indicators:
Traders may also rely on technical indicators to identify trend reversals.
Certain indicators, such as moving averages (SMA/MA), volume-weighted average price (VWAP), relative strength index (RSI), and moving average convergence divergence (MACD), can be used to identify changes in momentum and potential trend reversals.
Technical indicators can be used to help traders identify significant inflection points that would otherwise not be visible on a chart.
For example:
The RSI is a technical indicator that compares the magnitude of recent gains to recent losses to determine if stocks are overbought or oversold. Traders may expect a trend reversal when the RSI indicators reflect overbought or oversold conditions (even though stocks may remain overbought/oversold for a long time).
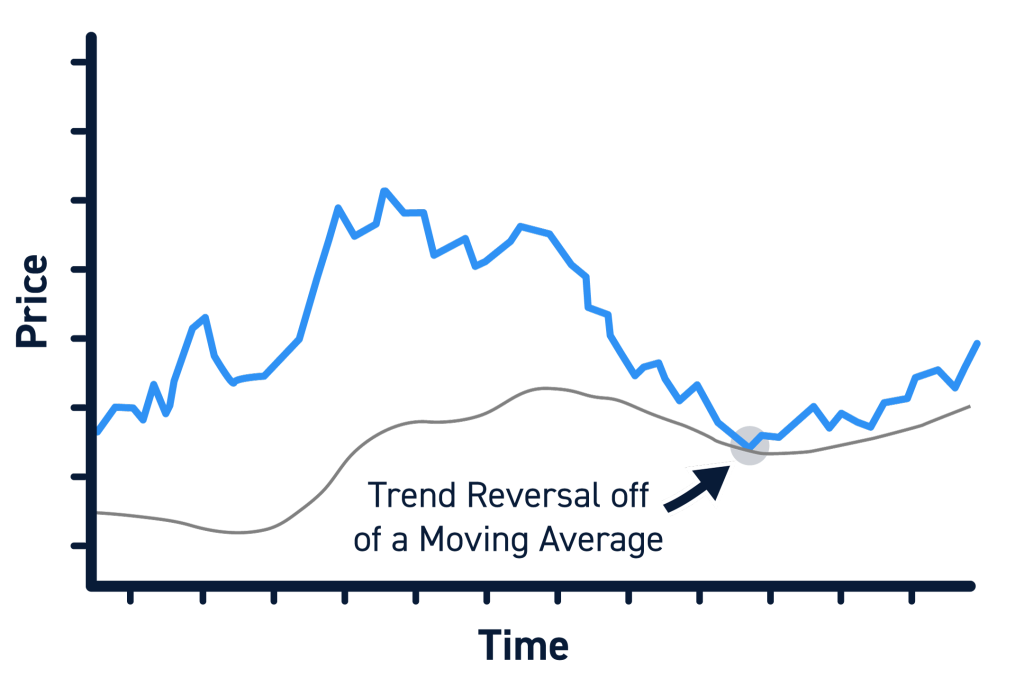
- Moving averages are used to smooth price action and can be used to help traders identify areas of support/resistance. For example, it’s common for the 50-day and 200-day simple moving averages to act as levels of support and resistance.
Best Practices When Trading Trend Reversals
Here are some best practices when trading trend reversals:
- Cut losses early – This is always important, but particularly important when you are trading against the trend. If your trade reversal thesis is negated, consider getting out of the trade quickly.
- Know the odds – Trend reversal indicators, levels, and patterns may offer higher-probability inflection points, but they are not guaranteed. A stock that has a 60% chance of reversing trend still has a 40% chance or continuing the trend. Mitigate risk accordingly.
- Look for volume – Strong trend reversals generally come with increased volume as more buyers/sellers enter the market. Be cautious of low volume trend reversals as they may be more likely to fail.
- Combine your indicators – A single indicator or pattern is rarely a strong enough foundation for a trade. Combine multiple indicators to form a stronger thesis.
- Stick to what you know – While there are dozens of chart patterns and indicators, you don’t need to master them all. Most traders stick with a few time-tested setups. Figure out what works for you and stick to it. For example, if the RSI isn’t an insightful indicator for you, don’t use it.
Conclusion
To summarize, identifying trend reversals is an important part of trading, as it can allow traders to plan a reversal trade or exit an open position at extremely opportune times.
However, it is important to remember that trend reversals can never be spotted with 100% confidence, and traders should be extra cautious when attempting to identify a reversal.
Additionally, traders may have more success joining trends rather than trying to catch reversals, though certainly don’t let that discourage you from trading reversals altogether.
There are several ways to identify trend reversals, including trendline breaks, resistance at key price levels, trend reversal chart patterns, and various trend reversal indicators.
By using a combination of these methods, traders can increase their chances of successfully identifying a trend reversal, so it is strongly recommended traders consider multiple reversal signals before entering a trade.
And perhaps most importantly, it is crucial traders always have a stop-loss in place and consider the full picture, including other factors like overall market performance, company strength, news catalysts, and anything else that may be relevant at the time.
All in all, if you remain diligent in your approach, use multiple signals to identify trend reversals, and properly manage your risk, you will set the groundwork for implementing a successful trend reversal strategy.