

Inflation can have a big impact on the stock market, leaving unprepared investors in for a bumpy ride. In this article, we’ll explain why inflation impacts the stock market and take a closer look at how the stock market has reacted to inflation in the past.
What is Inflation?
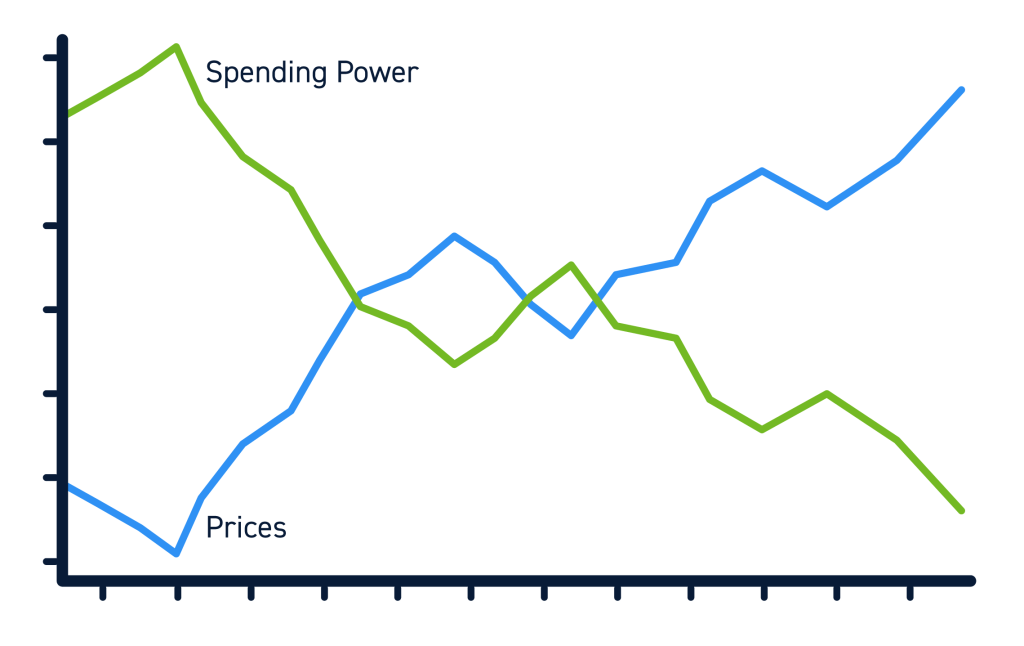
Inflation is a broad rise in prices across an entire economy. When inflation is high, prices of everything from food to housing to computers to cars typically go up at the same time, although not necessarily at the same pace. Inflation ultimately means that the purchasing power of a currency – the amount of stuff that, say, $100 can buy – goes down.
Why Does Inflation Impact the Stock Market?
Inflation can have significant impacts on a country’s economy, which ripples into impacts on the stock market. Here are two of the key reasons why inflation can rattle stock prices.
Business Impacts
Inflation generally isn’t good for businesses. Businesses have to pay more for raw materials as prices go up. In addition, if inflation persists, businesses could be forced to raise workers’ pay to adjust for higher costs of living. While companies can pass these increased costs onto customers, raising prices can spark backlash and/or decrease demand for a product. So, companies are left to either cut their profit margins or decrease their revenues.
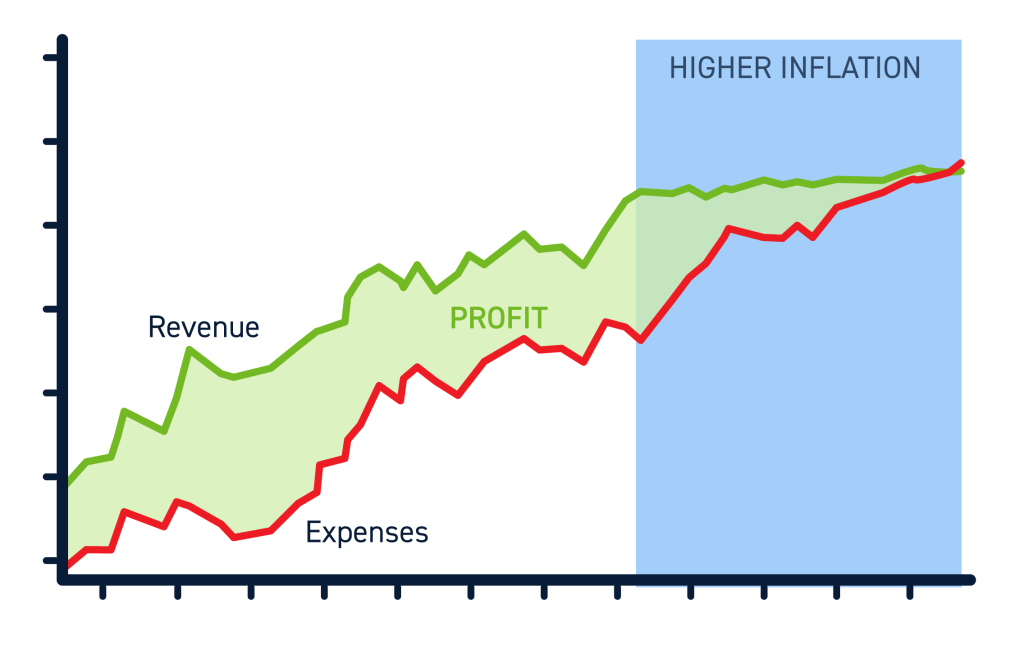
At the same time, spending by consumers tends to fall during periods of inflation. Individuals’ purchasing power declines, so consumers may be less likely to spend money on non-essential products and services.
This combination of reduced profit margins and reduced revenue for businesses can be bad for stock prices since it pushes companies’ earnings down.
Market Reaction
It’s hard for investors to know exactly how badly inflation will impact companies. However, given the potential cuts to profit margins and revenue, many investors react very negatively to any suggestion that inflation may be rising. Many investors choose to pull money out of the stock market and hold assets like bonds or even cash as soon as inflation starts going up.
This reaction is based as much on psychology as it is on market reality. But it can be enough to bring down stock prices even if inflation isn’t yet having a major impact on companies’ bottom lines. In some cases, companies that sell essential goods which aren’t as impacted by inflation also see their stock prices drop because of this market-wide reaction.
How Does Inflation Affect the Stock Market?
Figuring out how bad inflation is for stocks isn’t as simple as it might seem. A number of studies have looked at whether inflation leads to lower stock prices and come back with conflicting results.
The consensus among investors, stock analysts, and economists is that inflation typically has a negative impact on stock prices. However, the severity and persistence of inflation’s impact on stocks can vary widely between inflationary periods. In fact, stock prices can still go up during periods of inflation – just not as quickly as they might in the absence of inflation.
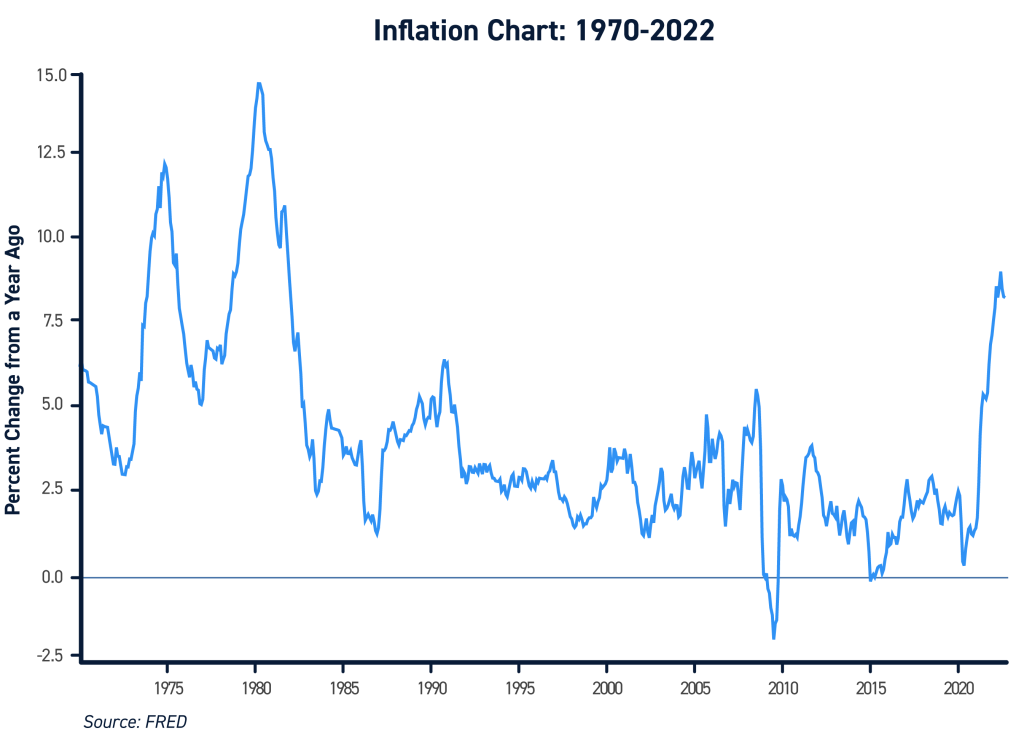
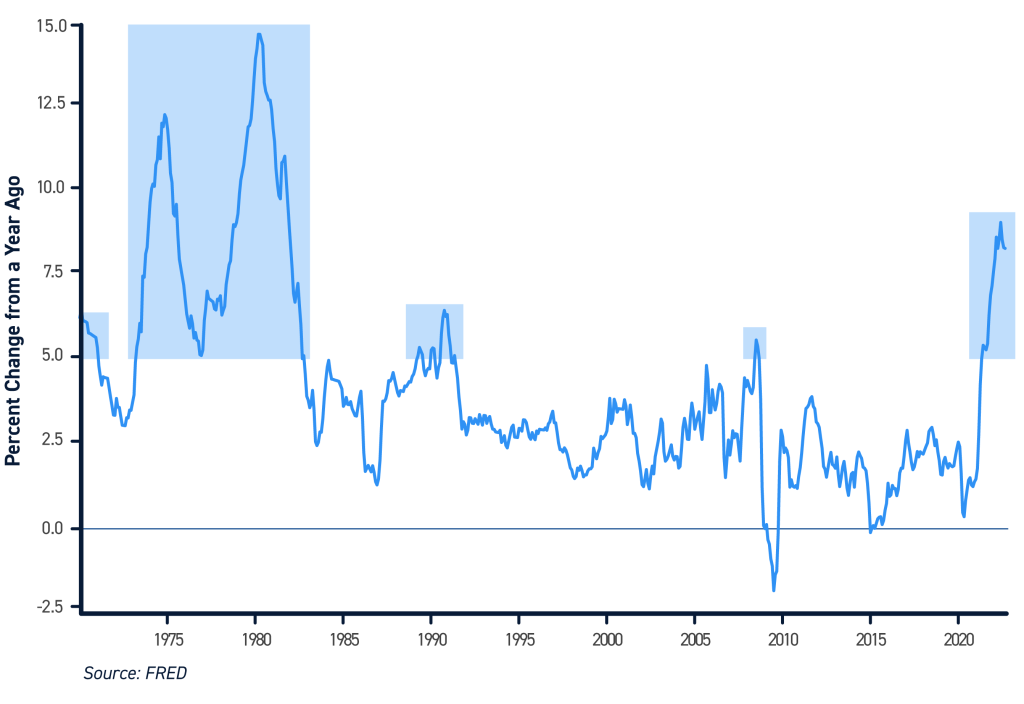
Since World War II, the inflation rate in the US has been over 5% only five times: in 1946-48, 1950-51, 1969-71, 1973-82, and 2008.
It’s important to note that only examining stock prices during periods of high inflation doesn’t tell the whole story of inflation’s impact on stock prices. Periods of high inflation may precede an economic recession, particularly if measures used to fight inflation – like raising interest rates – have the effect of slowing growth. A recession can then cause stock prices to fall even if inflation drops.
This occurred in the early 1980s. Inflation dropped from nearly 15% in 1980 to less than 5% in 1982. The fight against inflation contributed to a recession from 1981-1982, during which time stock prices fell 7.3%.
The takeaway is that inflation can be negative for stocks, but its effects are mixed and can be difficult to predict. Knock-on impacts of inflation, such as economic recession, can ultimately be more damaging to stock returns than inflation itself.
How Long Do Periods of High Inflation Generally Last?
Periods of high inflation have historically lasted only about two years at a time. The only time period in the last 75 years when inflation lasted longer was 1973-1982, and that was partly due to an oil embargo against the US by the Organization of Petroleum Exporting Countries (OPEC). The last time the US experienced inflation above 5%, in 2008, it lasted only two months.
Conclusion
Inflation can have a negative effect on the stock market because of its impacts on businesses and investors’ psychological reaction to inflation. However, periods of high inflation aren’t always correlated with market downturns. When periods of high inflation do occur, they have historically lasted only around two years.


