

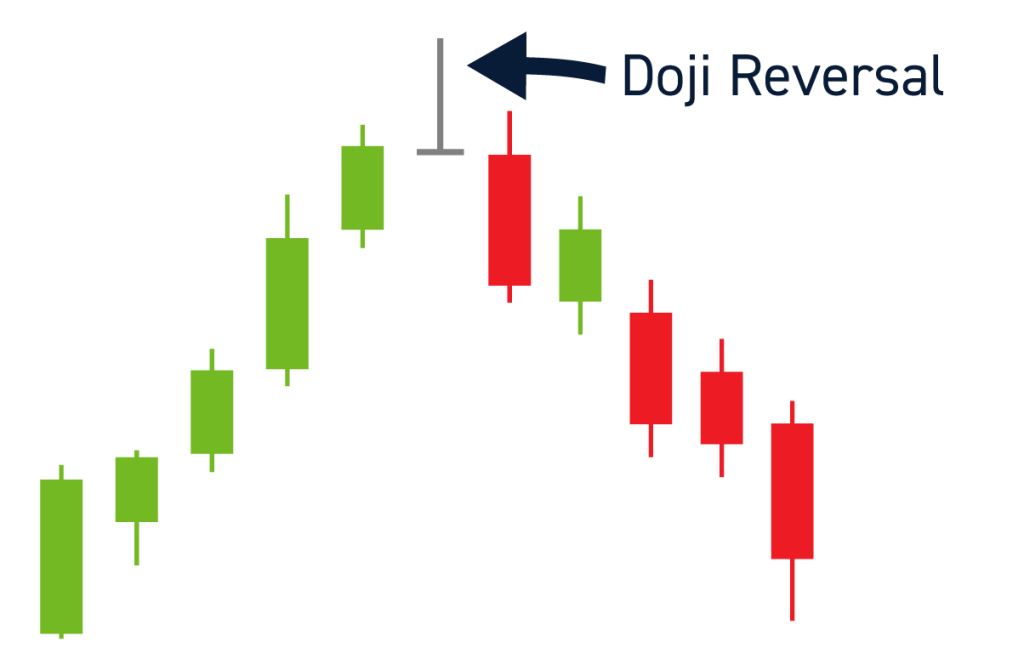
A Doji is a type of candlestick pattern that often indicates a coming price reversal. This pattern consists of a single candlestick with a nearly identical open and close.
In this guide, we’ll explain what the doji candlestick is and how traders can interpret it.
How Candlestick Patterns Work
Before we dive into the doji, it’s important to understand how candlestick patterns work. Candlestick charts were originally developed in Japan in the 17th century, but are now common across all countries and all markets.
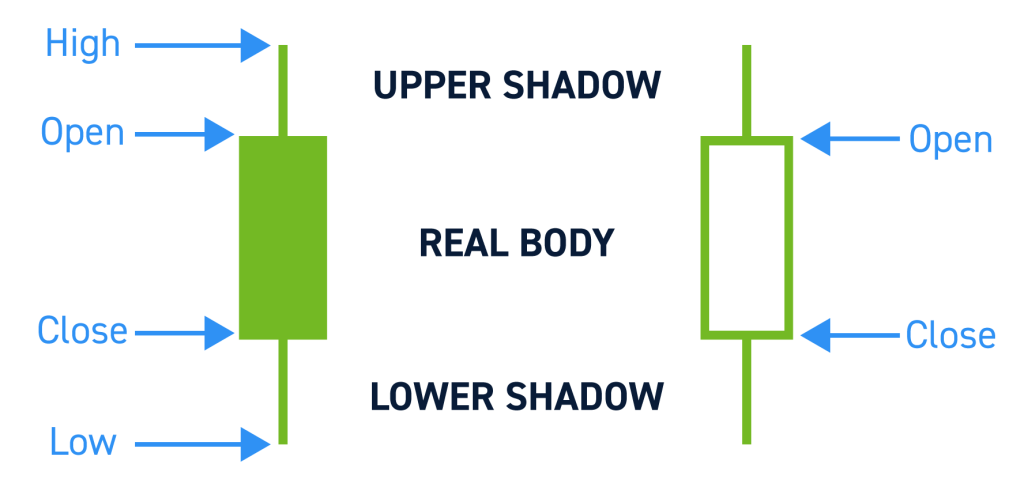
A candlestick consists of four components: the opening price, the closing price, the high price, and the low price for a given time interval. The opening and closing prices are shown as a rectangle and the high and low prices are shown as lines extending above and below that rectangle. Candlesticks enable traders to see at a glance whether bulls or bears won out during the time interval covered by the candlestick.
Candlestick patterns may consist of one or more candlesticks and provide information to traders about trend continuation, reversals, and other price action.
What is the Doji Candlestick Pattern?
The doji candlestick pattern consists of a single candlestick in which the opening and closing prices are nearly the same. This results in a candlestick that may look like a plus sign, a capital T, or an inverted capital T depending on the price action during the interval covered. The word “doji” means mistake in Japanese, referring to the fact that doji candlesticks are relatively rare.
While a single doji is a candlestick pattern in itself, it’s worth noting that dojis are also part of many multi-candlestick patterns.
Types of Doji Patterns
There are three main types of doji patterns.
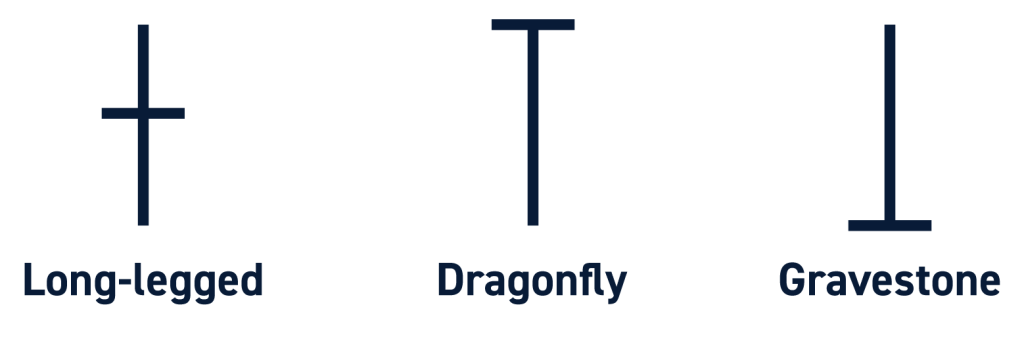
The long-legged doji is a neutral doji pattern. The opening and closing prices are near the center of the candlestick, with roughly equal-length lines representing the high and low prices of the interval. This type of doji suggests indecision or that neither bulls nor bears were able to take control.
The dragonfly doji is a bullish doji pattern. The opening and closing prices are near the top of the candlestick, with a long line coming out of the bottom to indicate the low of the interval. This pattern occurs when bears temporarily push the price down, but bulls strengthen and push the price back up before the candlestick interval closes.
The gravestone doji is a bearish doji pattern. The opening and closing prices are near the base of the candlestick, with a long line coming out of the top to indicate the high price. This pattern typically occurs when price action starts out bullish, but then bears take over and push the closing price back to the opening price by the end of the interval.
How to Trade Doji Candlestick Patterns
Traders can use doji candlestick patterns along with other candlestick patterns and technical indicators to spot trading opportunities. First, it’s important to identify the pattern at hand. A single doji provides important information about whether price action is bullish, bearish, or neutral. It may also be part of a multi-candlestick pattern that provides even more information.
It’s also important to make sure that doji candlesticks occur in the proper context. Doji patterns provide useful information when price action is trending, but they may not be indicative of any sudden changes when price action is sideways.
Traders also need to be careful not to confuse a doji pattern with a spinning top candlestick. Spinning tops have more separation between the opening and closing prices, and they typically indicate a trend continuation rather than a reversal.
Once you spot a doji, it’s good to look for confirmation before acting on it. Dojis are far from foolproof when used on their own. Following a dragonfly doji, for example, look for bullish price action and strong trading volume to confirm a bullish reversal. You should also check that technical indicators like MACD and RSI point to a bullish reversal before trading based solely on a dragonfly doji.
Conclusion
Doji candlestick patterns are single candlesticks that have nearly identical opening and closing prices. These candlesticks may indicate a bullish or bearish trend reversal. Traders should interpret doji candlestick patterns cautiously and look for confirmation in trading volume, price action, and other technical indicators before acting on them.


