

When it comes to technical analysis, there are a number of patterns that traders watch for in order to identify potential trading opportunities. One such pattern is the bullish pennant pattern. In this guide, we will discuss what this pattern is, the psychology behind it, as well as tips for trading this pattern successfully. Let’s begin!
What is a Bullish Pennant Pattern?
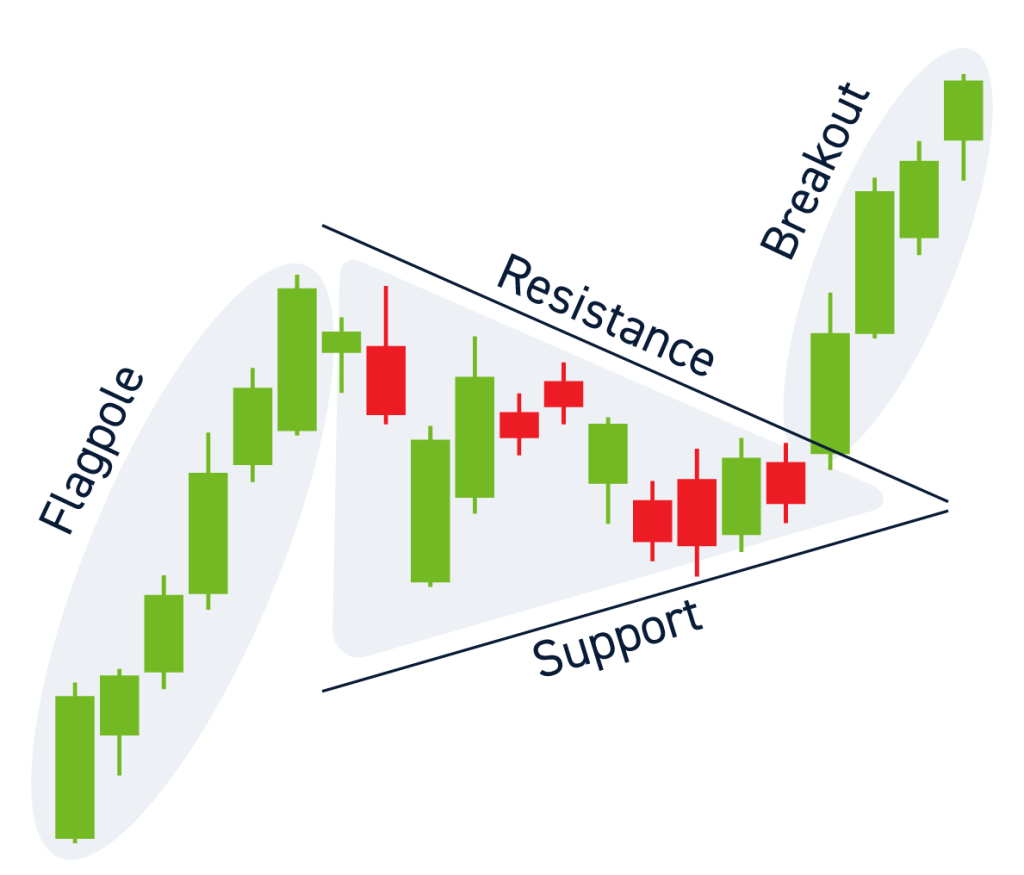
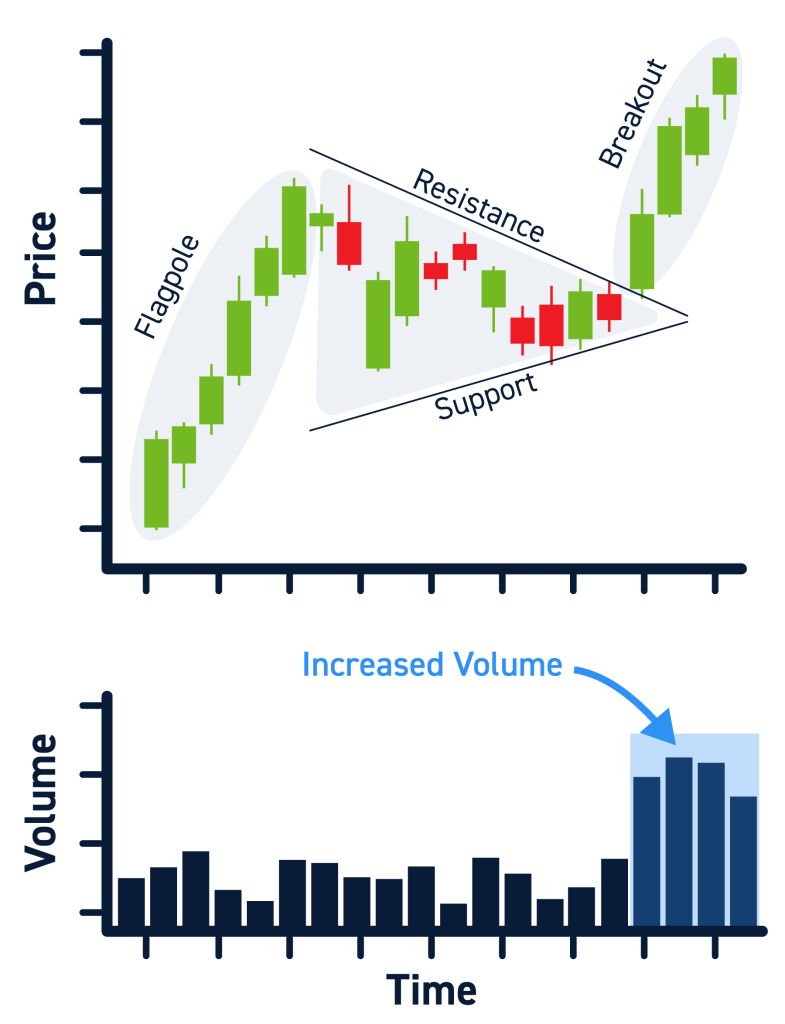
The bullish pennant pattern is a formation that occurs after an uptrend. It is characterized by a pennant (a small symmetrical triangle) that forms as the market consolidates. The breakout from this consolidation typically occurs to the upside, signaling a continuation of the uptrend. The pattern is considered bullish because it reflects the underlying psychology of traders during an uptrend.
When prices are in an uptrend, traders generally have bullish sentiments and are more inclined to buy than sell. This buying pressure creates demand for the stock, pushing prices higher. As the uptrend continues, some traders may begin to take profits or close their positions. This profit-taking leads to a period of consolidation, as there is no longer enough buying pressure to push prices higher. The pennant pattern forms as the market consolidates and traders have mixed emotions and opinions about the next direction of the stock’s price.
The psychology behind this pattern is that of bulls and bears battling it out during the period of consolidation. The bulls are trying to push prices higher, while the bears are fighting to keep prices from increasing. Eventually, the bulls win out and stock prices break out to the upside.
Components Of a Bullish Pennant Pattern
The critical components of a bullish pennant pattern are:
An Uptrend
There must be an existing uptrend before this pattern can form. This is because the pattern is a continuation signal and reflects the underlying bullish sentiment in the market. The uptrend is often characterized by formation of higher highs and higher lows as the stock breaks market structure to the upside.
A Pennant
This is a small symmetrical triangle that forms as the market consolidates. It is important to note that the pennant should formed after an uptrend has already begun, not before. The pennant has converging trendlines because the consolidation range gets smaller until the stock eventually breaks out.
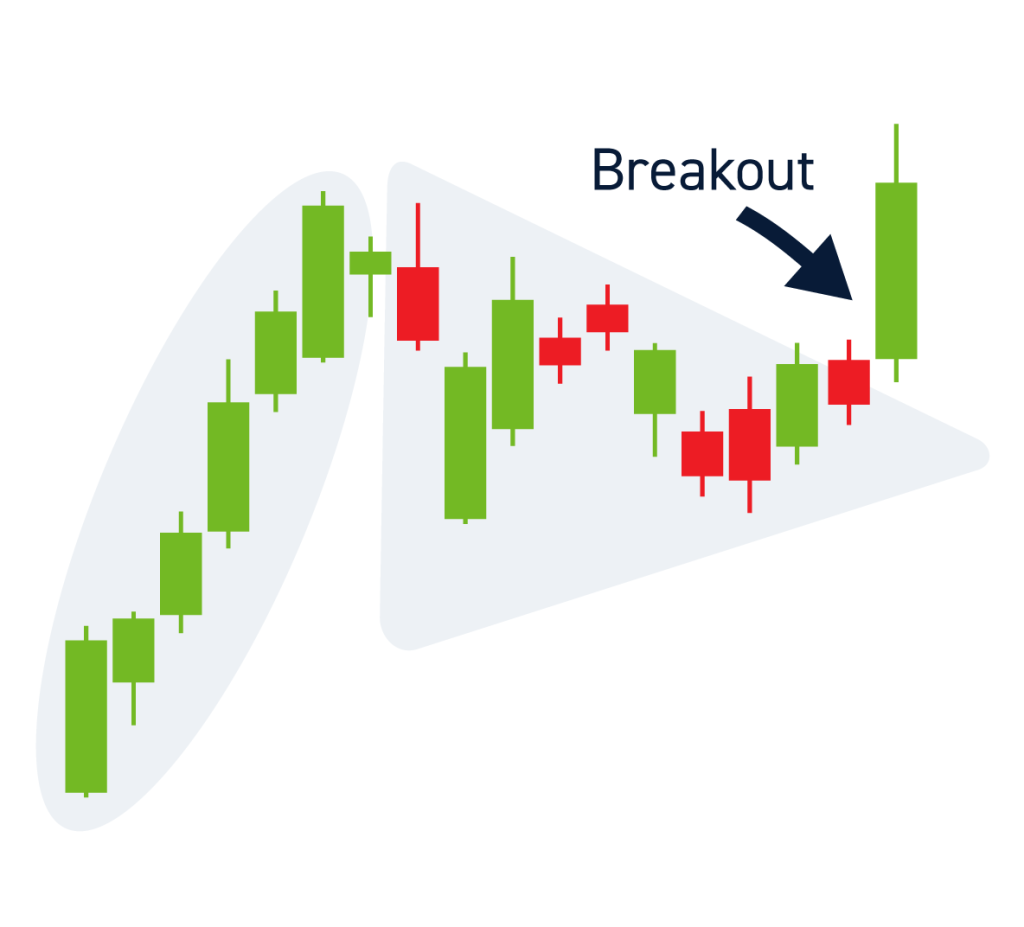
A Breakout
The final component of this pattern is the breakout from consolidation. This typically occurs to the upside, signaling a continuation of the uptrend.
How to Trade a Bullish Pennant Pattern
There are four steps to trading this pattern successfully:
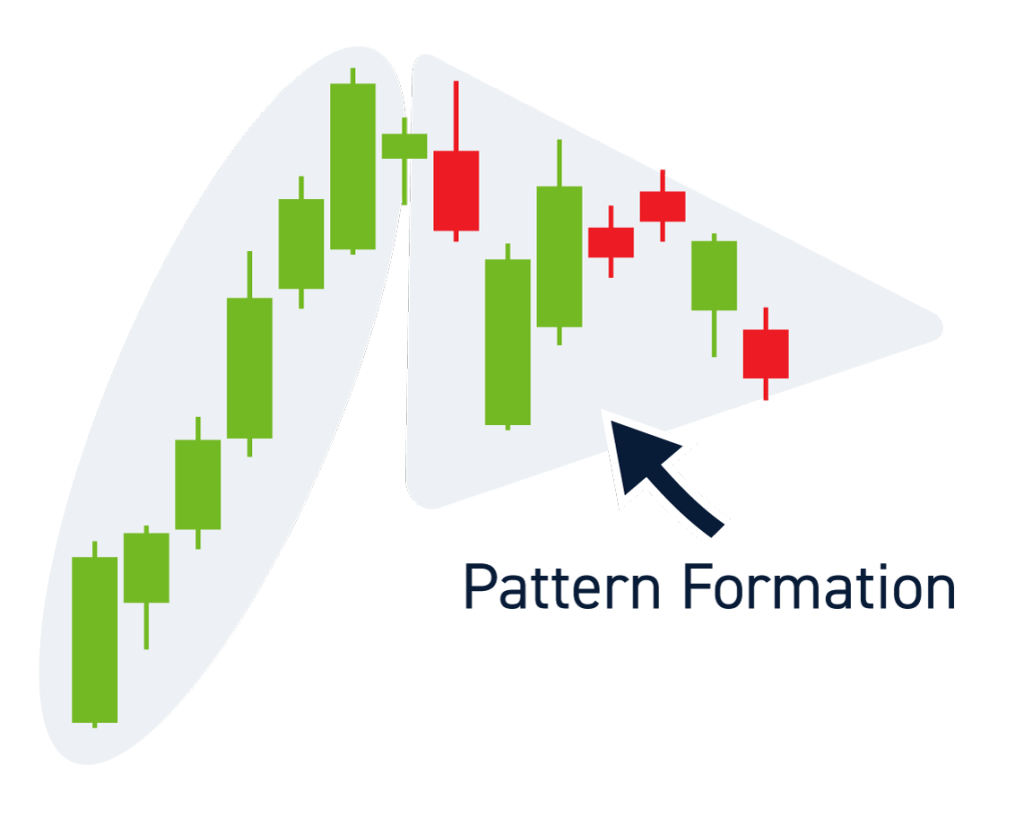
Step One: Identify the Pattern Formation
The first step is to identify the pattern formation. This includes identifying an existing uptrend and the formation of a pennant after that uptrend has begun.
Step Two: Wait for the Breakout
Once you have identified the pattern, it is important to wait for the breakout from consolidation before entering a trade. This breakout typically occurs to the upside, signaling a continuation of the uptrend.
Step Three: Enter a Trade
Once you have identified the breakout, you can enter a trade by buying the stock on your stock brokerage platform.
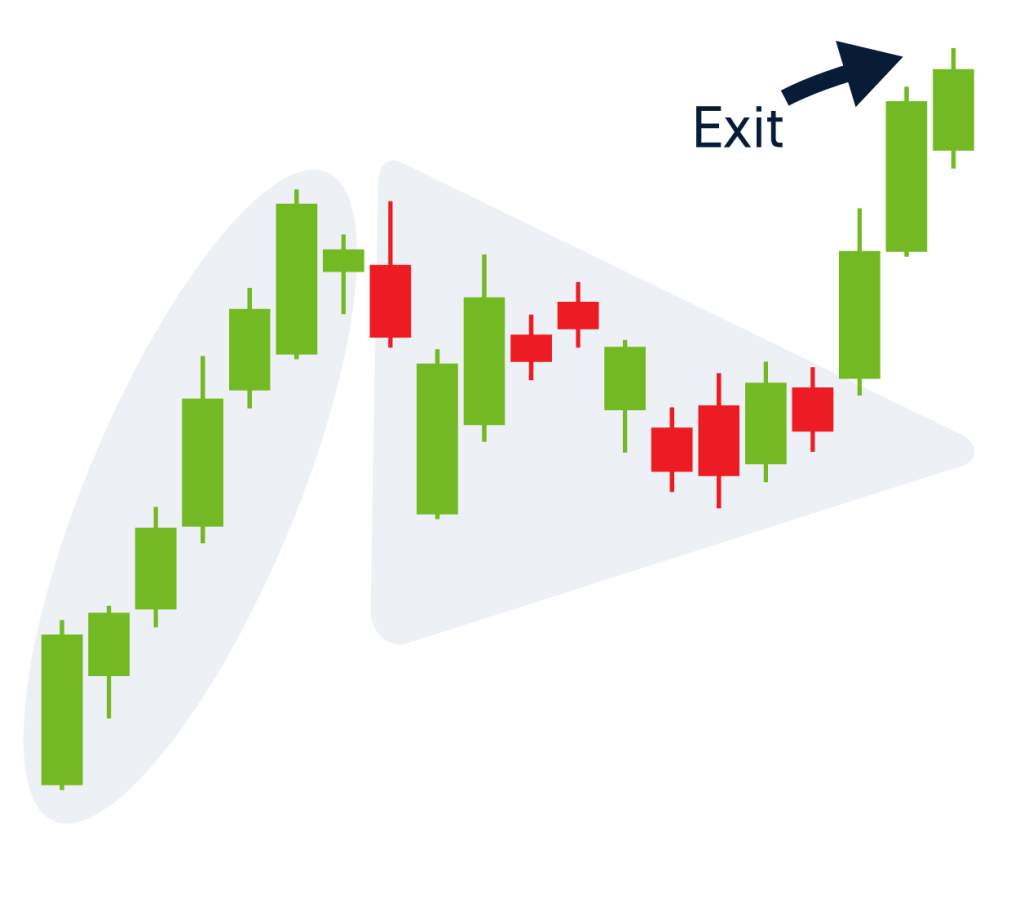
Step Four: Exit the Trade
The final step is to exit the trade. This can be done by either taking profits at a predetermined level or by using a stop-loss order.
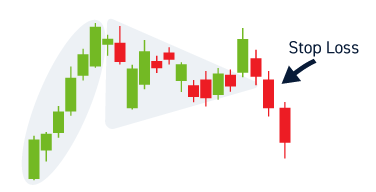
Stop Loss on Pennant Resistance
One way to place a stop loss when trading this pattern is to put it on pennant resistance. This will help you manage your risk and protect your profits in case the breakout does not occur or the market reverses course. Some traders prefer to place their stop losses below the breakout candle. Ultimately, it’s up to you to decide which method works for you.
Profit Target
The profit target for this trade is up to the trader. Some traders aim for a profit target equal to the height of the uptrend leading into the pennant formation, while others may take a more conservative approach and aim for a smaller profit target. Make sure your target is realistic and in line with your risk management strategy.
Tips for Trading Bullish Pennant Patterns
There are a few things to keep in mind when trading this pattern:
Remember, Context Matters
It is important to remember that the pennant should form after an uptrend has already begun. This is because the pattern is often a continuation signal and not a reversal pattern. Paying attention to this context may put the odds in your favor, and ensures that you are trading in line with the trend.
Wait for the breakout
One of the most important things to note when trading this pattern is to wait for the breakout from consolidation before entering a trade. This will help you avoid false breakouts and ensure that you are getting into the trade at a good price. A breakout occurs when the stock’s price breaks out of the pennant’s resistance. If you are a conservative trader, you can wait for the breakout candle to close before entering the trade.
Look for high trading volume
Volume refers to the volume of trading activities as indicated by the volume bars under the price chart. The strongest breakouts occur on high volume, so be sure to look for this when trading this pattern.
Have an exit plan
As with any trade, it is important to have an exit plan before entering into the market. This will help you manage your risk and protect your profits.
FAQ
What is the psychology behind the bullish pennant pattern?
The psychology behind the bullish pennant pattern is simple: it’s a continuation signal that occurs when the market consolidated after an impulse. This is due to the interaction of buyers and sellers. When bullish pressure overwhelms sellers, the stock experiences a bullish breakout.
What is the difference between a bullish pennant and a bearish pennant?
A bearish pennant signals a potential continuation of a downtrend, while a bullish pennant signals a continuation of the uptrend.
What is the difference between a bullish pennant and a bull flag?
A bull flag is a continuation pattern that typically forms after a sharp rally or decline as the market consolidates within two parallel trendlines. A bullish pennant is also a continuation pattern, but it typically forms after an extended uptrend and the market consolidates within converging trendlines.
Where should I set my stop loss on a bullish pennant breakout?
One way to place your stop loss is on the resistance line of the pennant. This will help you manage your risk in case the breakout does not occur or the market reverses course.
Where should I set my profit target on a bullish Pennant Pattern?
The profit target for this trade is up to the trader. Some traders aim for a profit target equal to the height of the uptrend leading into the pennant formation, while others may take a more conservative approach and aim for a smaller profit target. Make sure your target is realistic and in line with your risk management strategy.


