

If you are an active stock trader, then you may have come across price action tools and indicators for technical analysis. From trading indicators and chart patterns to technical analysis theories, there are many strategies to choose from.
Candlestick patterns are price action patterns that can be used to forecast price movement. Their uniqueness lies in the ease with which they can be learned and integrated into multiple trading strategies. There are bullish and bearish variations of these patterns, but in this article, you will learn the bullish candlestick patterns that can be used in stock trading. Let’s begin.
What is a Candlestick Pattern?
A candlestick pattern is a candlestick presentation that shows the interaction between buyers and sellers in the stock market. The nature of the candlestick (body and wicks) gives you an insight into the most likely direction of the stock’s price. As such, bullish patterns act as confluence for long positions, while bearish patterns show that the stock is likely to assume a downtrend.
What You Need to Know Before Trading Candlestick Patterns
Now that you understand candlestick patterns, here are some things to note before using them.
Patterns Are NOT Guaranteed to Work
Like most technical analysis tools, candlestick patterns show the likely direction of a stock’s price, but this isn’t a guarantee. If you use them correctly, you may be able to increase your win rate and improve your trading results. However, every moment in the stock market is unique, as such, it’s difficult to consistently predict stock prices based on candlestick patterns alone.
Context Matters
While using candlestick patterns, make sure you factor in the market environment. There are different types of patterns used for continuations and market reversals. For example, If you are trading a stock that is in a strong uptrend, it’s advisable to trade bullish continuation patterns if you have reasons to believe the uptrend will continue. Trading these patterns in line with the big players in the stock market can put the odds in your favor.
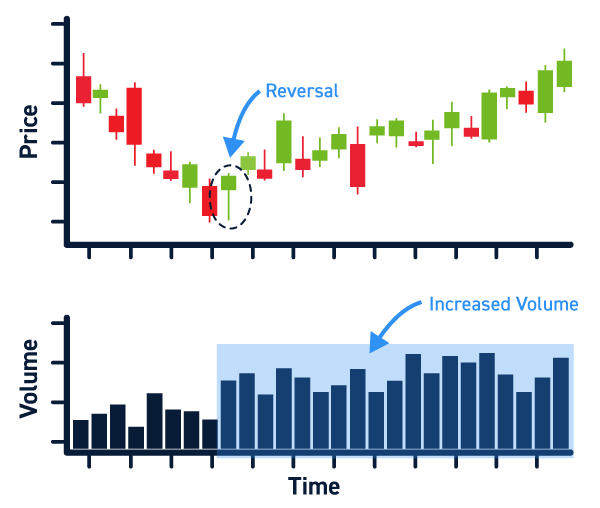
Volume adds conviction
Volume is usually indicated by volume bars located below or beside your price chart, depending on which platform you are using. While trading candlestick patterns, candlesticks that are shown to have high volume are believed to have a higher likelihood of success compared to those with low volume. This is because most traders believe the candle volume correlates with the volume of trading activities that occurred in a given time period.
Patterns should be combined with other indicators
Candlestick patterns should be used with confluence. This means you need to use other confirmations and technical analysis tools to confirm the trade signals. You can combine these patterns with your stock trading indicators to create a robust trading strategy and possibly get better results.
Bullish Candlestick Patterns – Continuations vs. Reversals
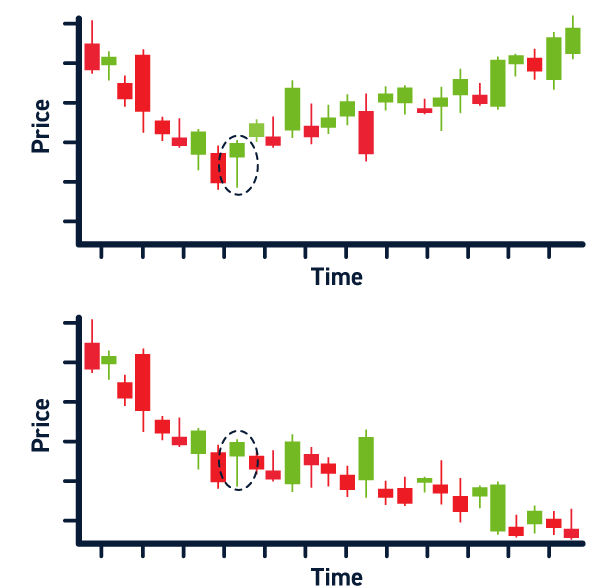
Bullish candlestick patterns suggest that a stock’s price will likely begin an uptrend. They can occur as continuation patterns or reversal patterns.
Bullish continuation patterns occur in uptrends and show that the uptrend is likely to continue.
Bullish reversal patterns occur in stocks that have been in downtrends and show that the downtrend is losing momentum. Hence, an uptrend is likely to begin.
Bullish Candlestick Patterns
Here are eight bullish candlestick patterns to look out for.
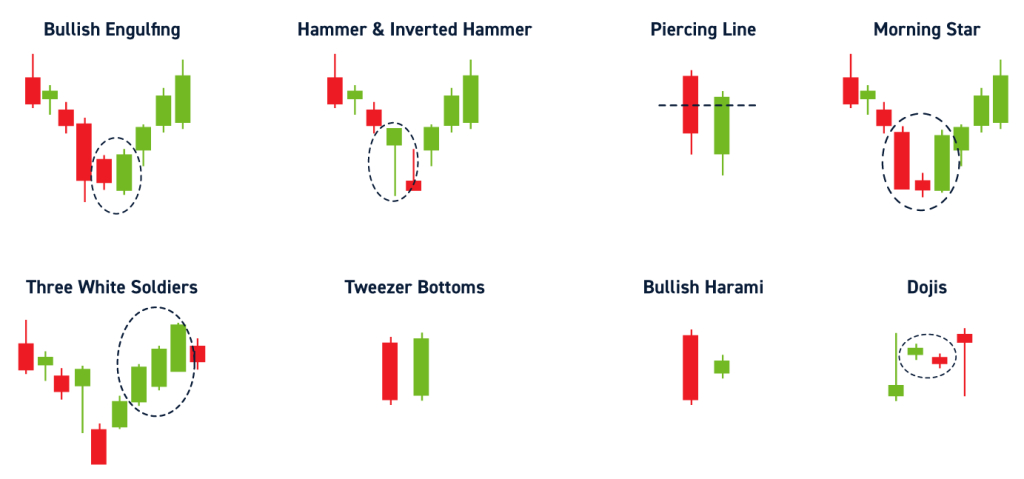
Bullish Engulfing Pattern
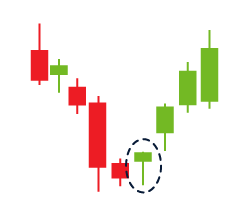
The bullish engulfing pattern is a reversal candlestick pattern that suggests the end of a downtrend. It presents as a large bullish candle that ‘engulfs’ the previous candle.
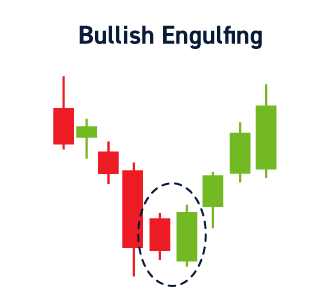
The bullish engulfing is a significant price action signal when it occurs at key levels in the stock market. These key levels include support levels, demand zones, trend lines, etc.
For a bullish engulfing to be valid, it should have a high volume indicated by the volume bars, and its body should completely engulf that of the previous candle. This is important to note while trading this price action signal.
The psychology behind the formation of this pattern is the fact that buyers come in at key levels. As such, the volume of their trades increases the buying pressure and causes the bullish candle to engulf the previous candle; as a sign of strength or significant buying pressure.
Hammer & Inverted Hammer
The hammer and inverted hammer are unique candlestick patterns that appear to be opposites but actually show a bullish reversal.
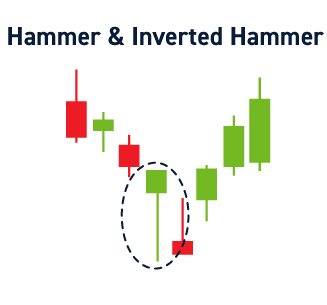
The hammer, as the name suggests, is shaped like a hammer. The lower part of this candle is a wick of considerable length, while the upper part is the candle body. In other words, the candlestick has a long wick and a small upper body.
The inverted hammer is like an inverted version of the hammer. It is a candlestick with a long upper wick and a small lower body.
While trading the hammer or inverted hammer, the type of candle body isn’t significant. This means that the hammer could close as a long wick with a small bearish body yet remain valid. To help you understand this, let’s discuss the psychology of the hammer’s formation.
The long wick shows rejection of a key level. Rejection in stock trading is simply the inability of sellers to move prices lower. As such, buyers come in and push prices upwards, leading to a rejection and the formation of a long wick.
Now I’m sure you are wondering why the inverted hammer is a bullish pattern despite its long upper wick. Well, it’s considered a bullish candlestick pattern because the small lower body shows the reduction in selling pressure as buyers enter the market.
Piercing Line
The piercing line pattern is formed by two candlesticks and suggests a bullish reversal. The first candle is a bearish candle, while the second is bullish. The bullish candle gaps lower by opening at a price lower than the close of the preceding bearish candle and then closes above the midpoint of the bearish candle.
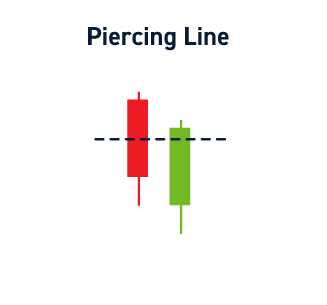
While using this pattern, note the length of the candle as this is crucial to applying it correctly. Both candles should have large bodies, and the probability of success is increased if the pattern appears at key price levels.
Morning Star
The morning star is a 3-candle pattern that can be used to forecast bullish reversals with a significant degree of accuracy.
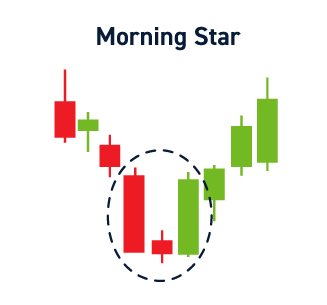
The first candlestick is usually bearish with a medium-sized or large candle body. This shows the presence of sellers in the market.
The second candle is small-sized, preferably one with a small body. This shows the reduction in selling pressure as buyers come into the market.
The third candle is a bullish candle, preferably one with a large body that engulfs the preceding small candlestick.
The psychology behind the formation of this pattern is the transition of the market from being bearish to bullish.
Three White Soldiers
The three white soldiers are simply three consecutive bullish candles which show that buyers have entered the market with a considerable amount of buying pressure.
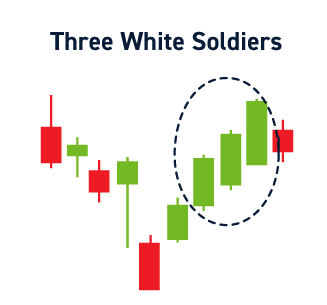
This pattern can be traded with other price action indicators like trend lines and the Fibonacci retracement tool.
While using this pattern, note that the size of the candles, as well as the candle bodies, are significant. The candle volume is indicated by volume indicators found on charting platforms. Since the candles show an influx of buyers or ‘buy’ orders, they should have large bodies and minimal wicks. Before establishing the formation of this pattern, wait for the candles to close as bullish candles.
Tweezer Bottoms
Tweeter bottoms are widely traded bullish patterns that can be used to trade different assets, including stocks. It’s a simple pattern made up of two candles, a bearish candle followed by a bullish one, and both should be of comparable size.
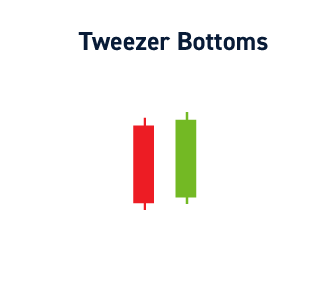
The bullish candle should open at the close of the bearish one, and both candles should have significant volumes. The closing price of the bullish candle should be at or above the opening price of the bearish candle.
This pattern is often spotted at the bottom of a downtrend. Since the size of both candles is similar, it suggests that the selling pressure in the bearish candle was matched by the buying pressure of the bullish candle. This shows the downtrend could reverse.
Bullish Harami
The bullish harami is a notable bullish reversal pattern that’s often regarded as the opposite of the bullish engulfing pattern. It is formed by two candlesticks; a large bearish candle followed by a small bullish one.
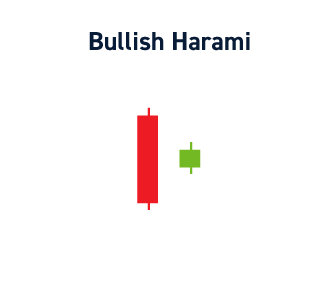
The bullish candle should be small enough to ‘fit’ into the bearish candle because its open, close, high, and low will be within the range of the bearish candle. This is a crucial factor to consider before trading this pattern.
When the bullish harami appears, you can confirm the reversal using various tools such as market structure and oscillators. Most traders wait for the formation of a higher high (also called a break of market structure) before entering trades.
This pattern is backed by the belief that the small bullish candle appears because sellers have become exhausted by failing to push prices lower.
Dojis
Dojis are also called ‘indecision’ candles. They appear as small to medium-sized candlesticks with tiny candle bodies. The small candle body shows the inability of buyers to push prices higher and the inability of sellers to move prices lower.
But, at key levels, the type of doji formed can be used to determine the most likely direction of price.
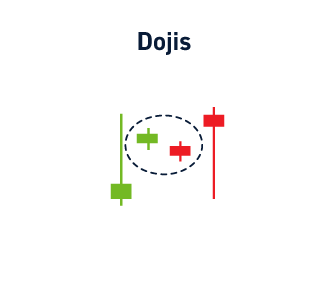
There are two types of dojis;
- Gravestone doji
- Dragonfly doji
The dragonfly doji is regarded as a bullish reversal pattern, while the gravestone doji is interpreted as a bearish reversal pattern.
The dragonfly doji presents as a T-shaped candle. The candle had a long lower wick and a small or non-existent upper wick.
As discussed earlier, the long wicks show rejection of a key level in the stock market.
This pattern often occurs at the bottom of a downtrend. The sellers encounter strong support or demand when the Dragonfly touches the key price level, and the buying pressure causes the price to bounce back. This results in the formation of a T-shaped candle.
Conclusion: Bullish Candlestick Patterns
Ultimately, candlestick patterns, like other price action strategies, help you to forecast price movement and can improve your trading results when used correctly. But this isn’t a guarantee, so make sure you trade with confluence and manage your risk. There are lots of patterns to choose from. Decide which one resonates with you, and start practicing today!


