

There are different chart patterns that stock traders can use to help them make informed trading decisions. In this guide, we will focus on the bearish pennant pattern. This formation often signals a downtrend and can be used to predict price movements. We will discuss the psychology behind this pattern, as well as how to trade it.
What is a Bearish Pennant Pattern?
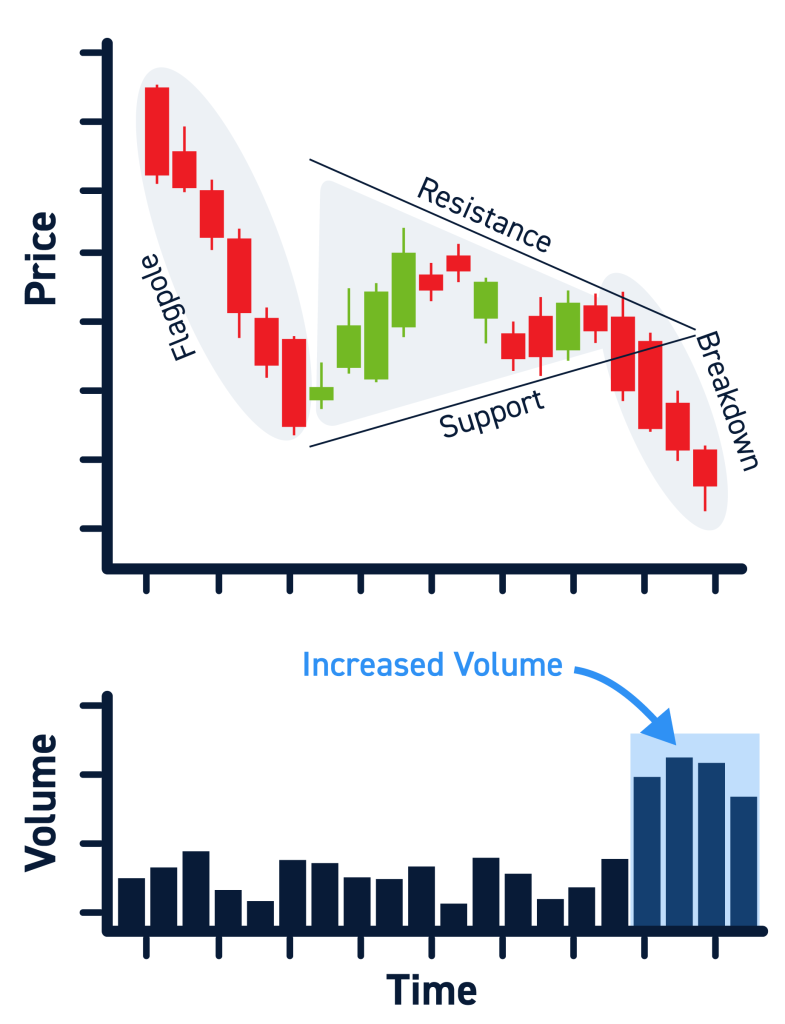
A bearish pennant pattern is a technical analysis tool that is used to predict price movements in the stock market. This formation occurs when there is a downtrend followed by a period of consolidation. The pennant is created when the highs and lows of this consolidation form a symmetrical triangle. A breakout from this triangle to the downside signals that the downtrend will continue, and prices will likely fall further.
There are a few different ways to trade this pattern, but before we get into that, it’s essential to understand the psychology behind it. This pattern often forms during periods of uncertainty or fear in the stock market. Traders are hesitant to enter into positions because they don’t know which way stock prices will move. This hesitancy creates a period of consolidation, which leads to the formation of the pennant.
When the pennant forms, it signals that there is still some uncertainty in the market. However, the breakout from the triangle usually happens quite quickly and can be used to signal a continuation of the downtrend.
Components of a bearish Pennant Pattern
There are three main components to this pattern:
The Downtrend
This is the initial move in the market that signals that prices are likely to fall. The downtrend should be well-established before the pennant forms. This ensures that you’re trading in line with the trend. Also, the downtrend should be relatively steep, increasing the chances of a successful breakout from the pennant.
The Pennant
This is the period of consolidation that happens after the initial downtrend. The highs and lows of this period form a symmetrical triangle, which signals that there is still some uncertainty in the stock market.
The Breakout
This is when prices break out from the triangle to the downside, signaling a continuation of the downtrend.
How to Trade a Bearish Pennant Pattern
Now that we’ve discussed what this pattern is and how it forms let’s take a look at how you might trade it. There are four steps you need to follow to trade this pattern successfully:
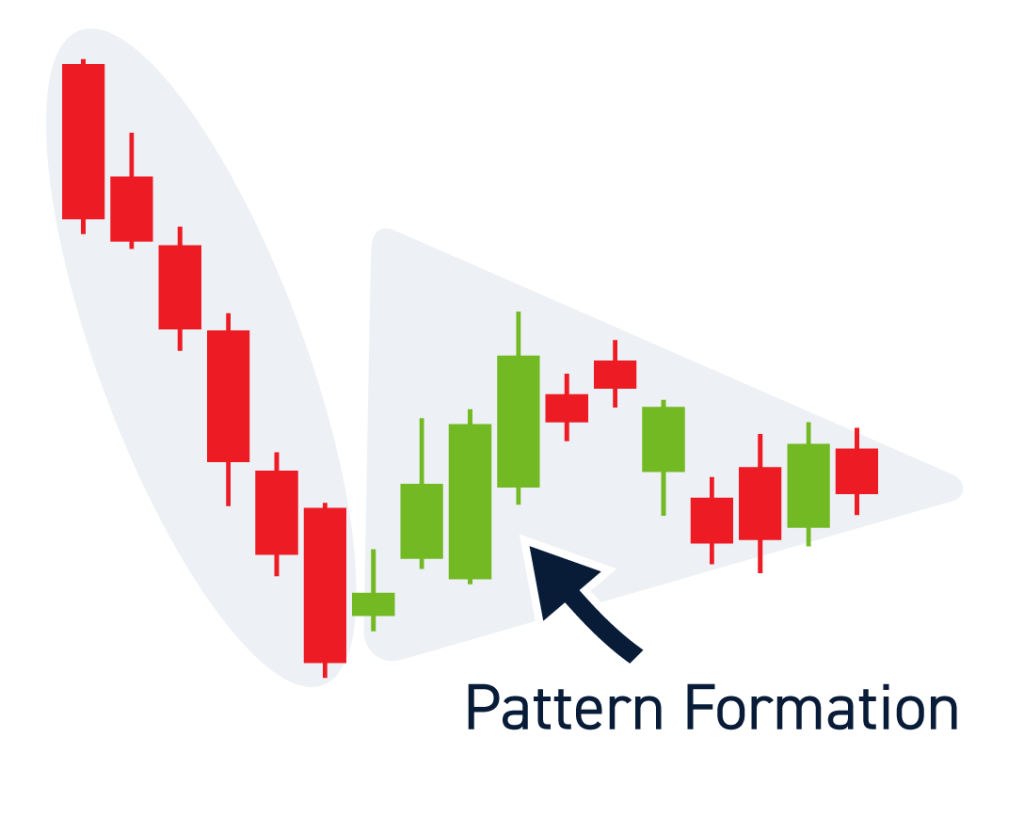
Step One: Identify the Pattern Formation
The first step is to identify the pattern formation. This means you need to look for a well-established downtrend followed by a period of consolidation. The highs and lows of this consolidation should form a symmetrical triangle. The upper trendline forms the pennant resistance while the lower one forms the pennant support.

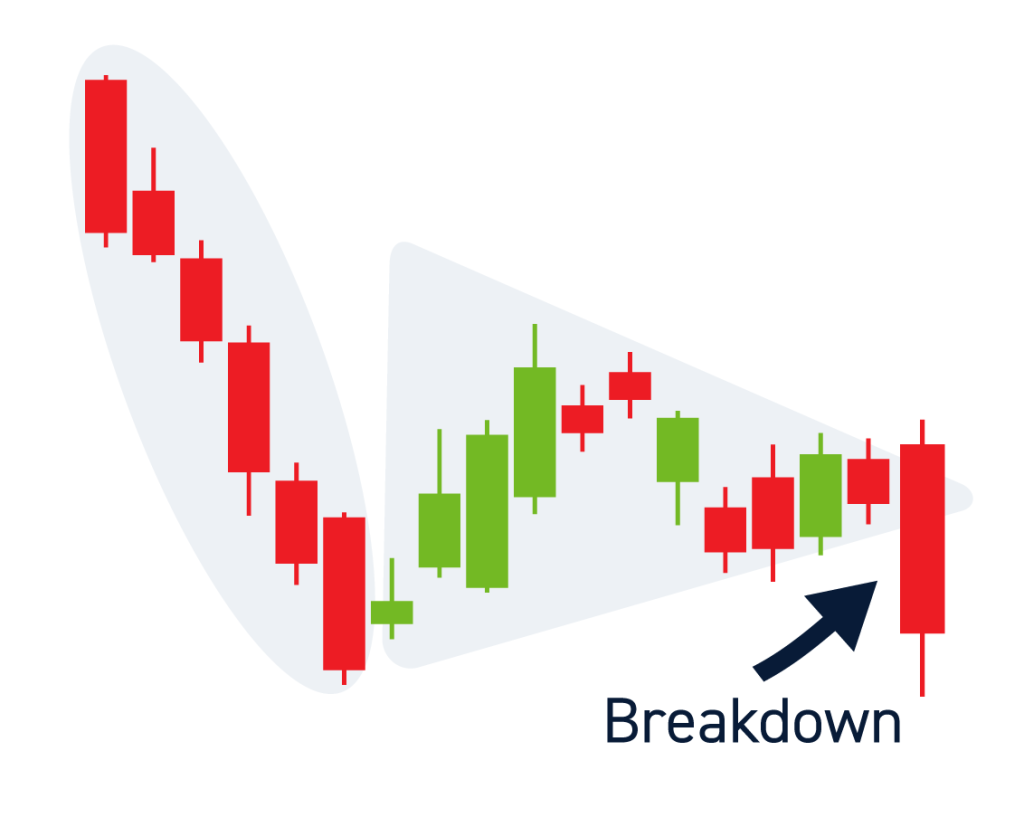
Step Two: Wait for the Breakout
Once you’ve identified the pattern, you need to wait for the breakout. This is when prices break out from the triangle to the downside, signaling a continuation of the downtrend. The breakout should happen quickly and with some volume behind it.
Step Three: Enter a Trade
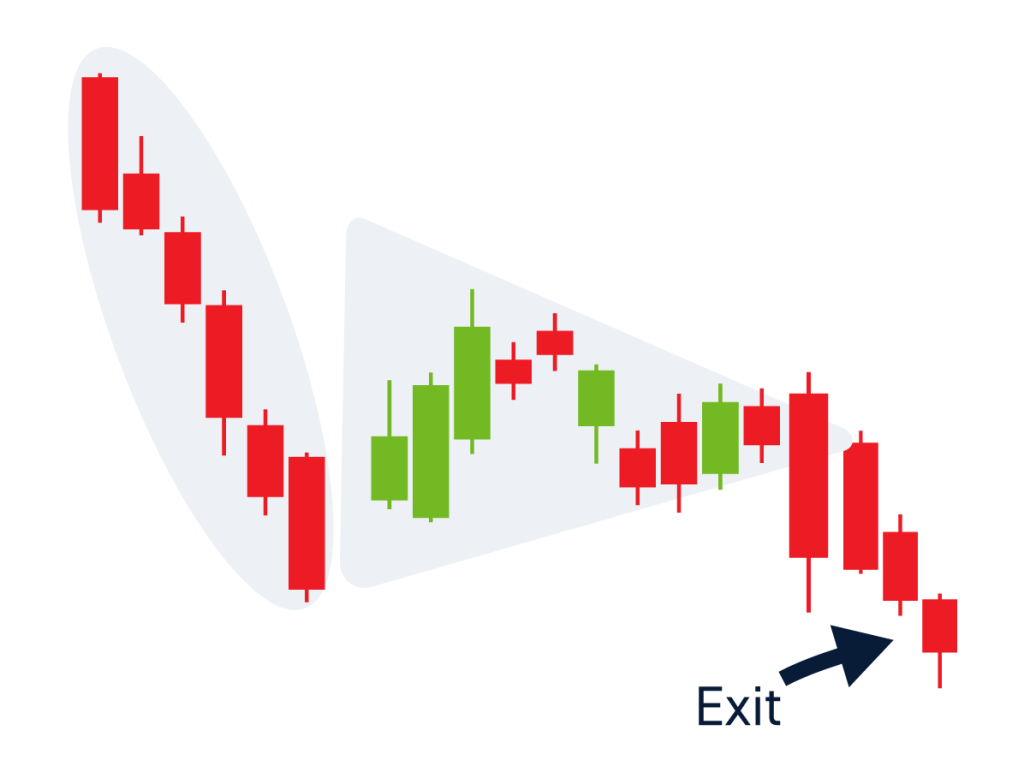
Once you see a valid breakout, you can enter into a short position. You can enter immediately after the breakout occurs or after the breakout candle closes.
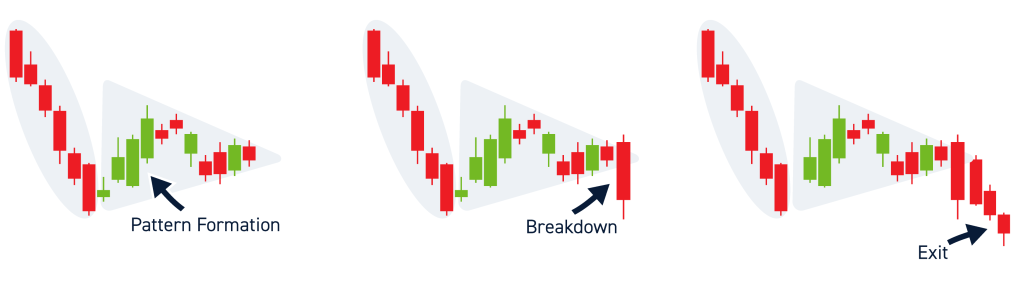
Step Four: Exit the Trade
Your profit target will depend on your risk tolerance and trading strategy. Some traders aim for a profit target equal to the height of the uptrend leading into the pennant formation. In contrast, others take a more conservative approach and exit when prices reach previous support levels.
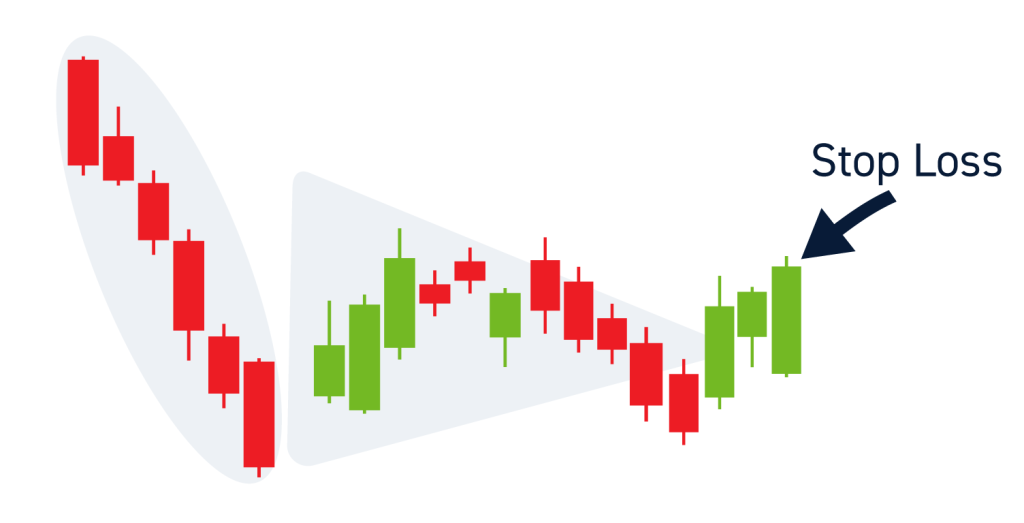
As with any trade, it’s crucial to have solid risk management and for some that means placing a stop loss. For this trade, you could place your stop loss just above the highs of the breakout candle. This will help you avoid false breakouts and protect your capital if prices move against you. You can also place a stop loss on the pennant support.
Tips for Trading bearish Pennant Patterns
Now that we’ve looked at how to trade this pattern, let’s take a look at some tips that will help you to trade it successfully:
Remember, Context Matters
This pattern should only be traded in the context of a downtrend. If stock prices are in an uptrend or sideways trend, this pattern is less likely to be successful. This is important because you need to ensure you’re trading in line with the trend.
Wait For The Breakout
One of the most important things to remember when trading this pattern is to wait for the breakout. Don’t try to anticipate the move, as this can lead to false breakouts. Instead, wait for prices to break out of the triangle before executing a trade.
Look For High Trading Volume
The strongest breakouts usually happen on high volume. This is because there are more traders participating in the market, and there is more buying or selling pressure behind the move.
Have an Exit Plan
As with any trade, it’s essential to have an exit plan before entering a position. This will help you to manage your risk and stay disciplined. Remember, the breakout may fail, so you need to be prepared to stop out if prices move against you.
FAQ
What is the psychology behind the bearish pennant pattern?
The psychology behind the pattern is that it signals a continuation of the downtrend. This is because there is a period of consolidation followed by a breakout to the downside. This suggests that stock traders are still bearish on the market and or stock and are looking for prices to continue falling.
What is the difference between a bearish pennant and a bullish pennant?
A bearish pennant happens after a downtrend, while a bullish pennant happens after an uptrend. The direction of the breakout will also differ, with prices breaking out to the downside in a bearish pennant and the upside in a bullish pennant.
What is the difference between a bearish pennant and a bear flag?
A bearish pennant is similar to a bear flag, but there are some key differences. The most crucial difference is that a bearish pennant has symmetrical highs and lows, while a bear flag has descending highs and lows. This suggests there is more selling pressure behind a bearish pennant than behind a bear flag.
Where to set my stop loss on a bearish pennant breakout?
There are a few different options for placing your stop loss. You can place it above the highs of the breakout candle, which will help you to avoid false breakouts. Alternatively, you can place it on the support of the pennant. This will help you to protect your capital if prices move against you. Decide which you may be comfortable with or your own level, but good risk management should be a part of every trade.
Where to set my profit target on a bearish pennant breakout?
Your profit target will depend on your risk tolerance and trading strategy. Some traders aim for a profit target equal to the height of the uptrend leading into the pennant formation. In contrast, others take a more conservative approach and exit when prices reach previous support levels.
Finally, practice makes perfect. The more you trade this pattern, the better you’ll get at it. Just remember to stay disciplined and always have an exit plan.


