

An ascending triangle chart pattern is a bullish technical pattern that typically signals the continuation of an uptrend. They can signal a coming bullish breakout above an area of resistance after it has been tested several times.
In this guide, we’ll explain what ascending triangle patterns are and how to trade them.
What is an Ascending Triangle?
An ascending triangle is a chart pattern formed when a stock repeatedly tests an area of resistance while setting consecutively higher lows. The highs around the resistance price form a horizontal line, while the consecutively higher lows form an ascending line. An ascending triangle pattern predicts a bullish breakout above the resistance area, typically around the time when the ascending line of the triangle would intersect the horizontal resistance line.
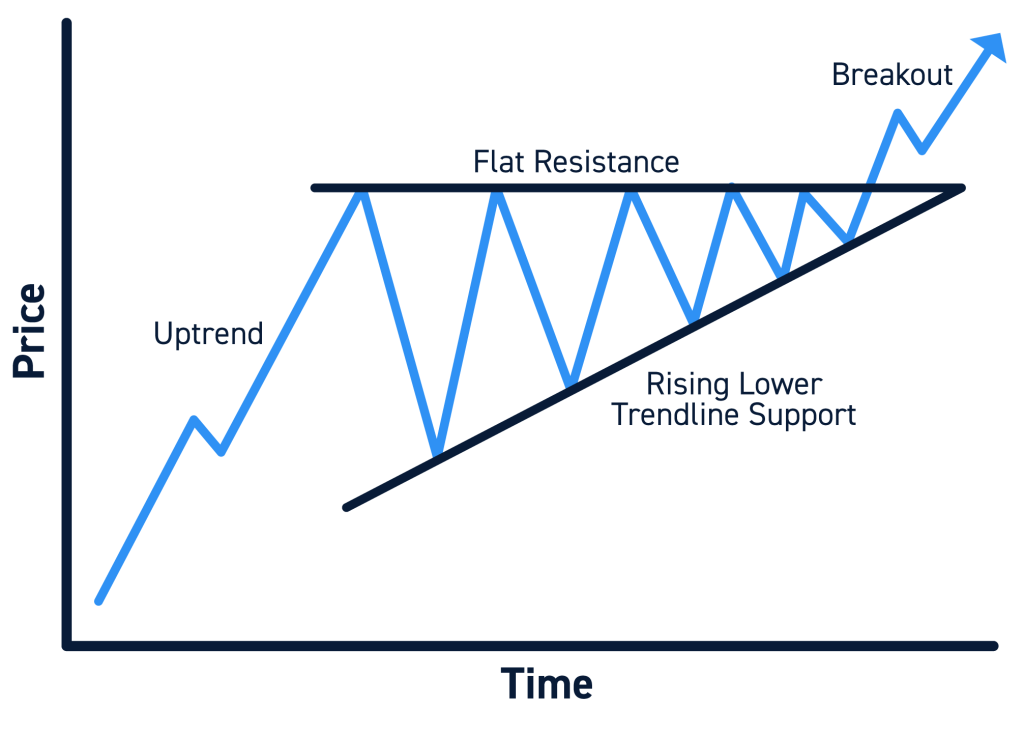
Ascending triangles form due to of accumulation in a stock following a sustained uptrend. There isn’t enough bullish momentum to break through an area of resistance, but bulls are buying up the stock on each dip. As bullish activity increases, each successive low is higher than the last until the stock eventually breaks out above the resistance band.
Components of an Ascending Triangle
There are several components of an ascending triangle pattern:
Preceding Uptrend
Ascending triangles normally form after an uptrend and the pattern signals a continuation of that uptrend. So, a suspected ascending triangle should come after a stock has experienced significant gains before meeting an area of resistance.
Resistance Area
The area of resistance forms the upper, horizontal line of an ascending triangle pattern. For the pattern to form, this resistance area should be tested several times. The more times that the resistance area is tested and not broken through, the stronger the eventual breakout may be.
Ascending Lows
The price of a stock in an ascending triangle pattern will oscillate between testing the resistance area and setting a series of lows, each one higher in price than the prior low. These lows form an ascending trendline that may be tested repeatedly as the pattern progresses.
Breakout
A bullish breakout above the resistance area signals the completion of an ascending triangle pattern. This breakout should occur on above-average volume. The expected magnitude of the breakout above the resistance line is equivalent to the price difference between the resistance line and the lowest low at the beginning of the triangle pattern.
How to Trade an Ascending Triangle
Here’s how traders can approach a stock that’s forming an ascending triangle pattern.
Step 1: Identify the Pattern Formation
To find an ascending triangle pattern, look for a stock that had a strong uptrend and is now trading sideways. A horizontal area of resistance should be clearly visible in the chart, while drawing trendline across the stock’s lows should yield an ascending line.
Step 2: Wait for the Breakout
Ascending chart patterns can take weeks to months to fully develop. Each new test of the resistance area has the potential to break out, but traders should be wary of false breakouts. A sustained breakout will typically be accompanied by above-average trading volume. The closer the ascending trendline comes to meeting the horizontal resistance line, the more likely a breakout is to occur.
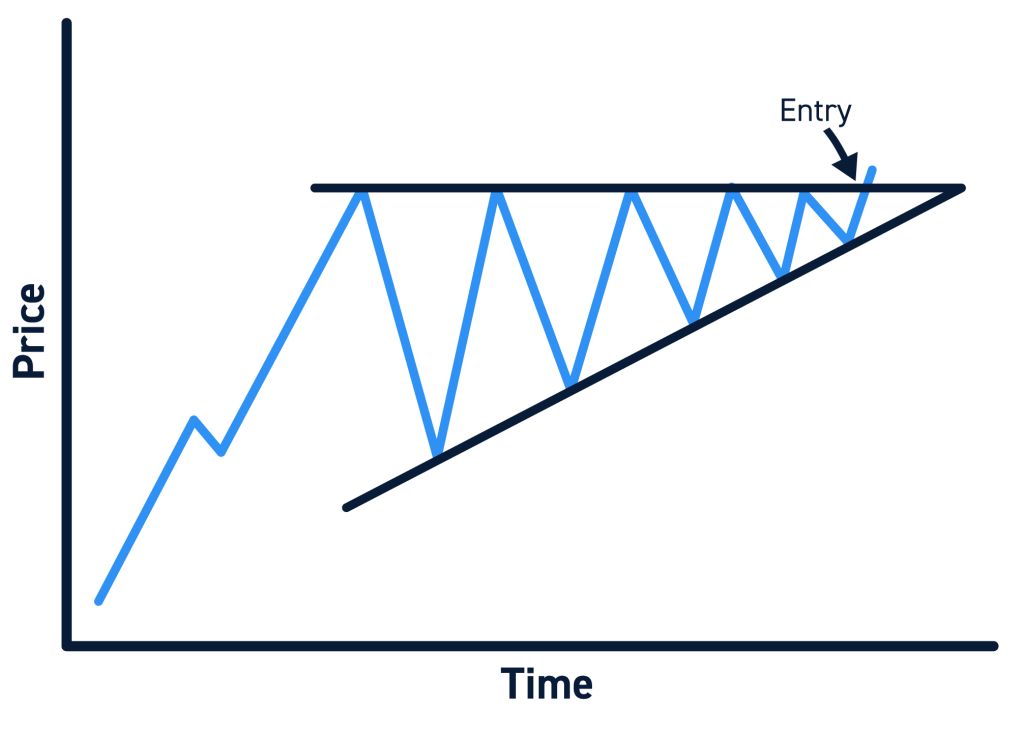
Step 3: Enter a Trade
Traders can enter a bullish trade once a breakout is confirmed.
Step 4: Exit the Trade
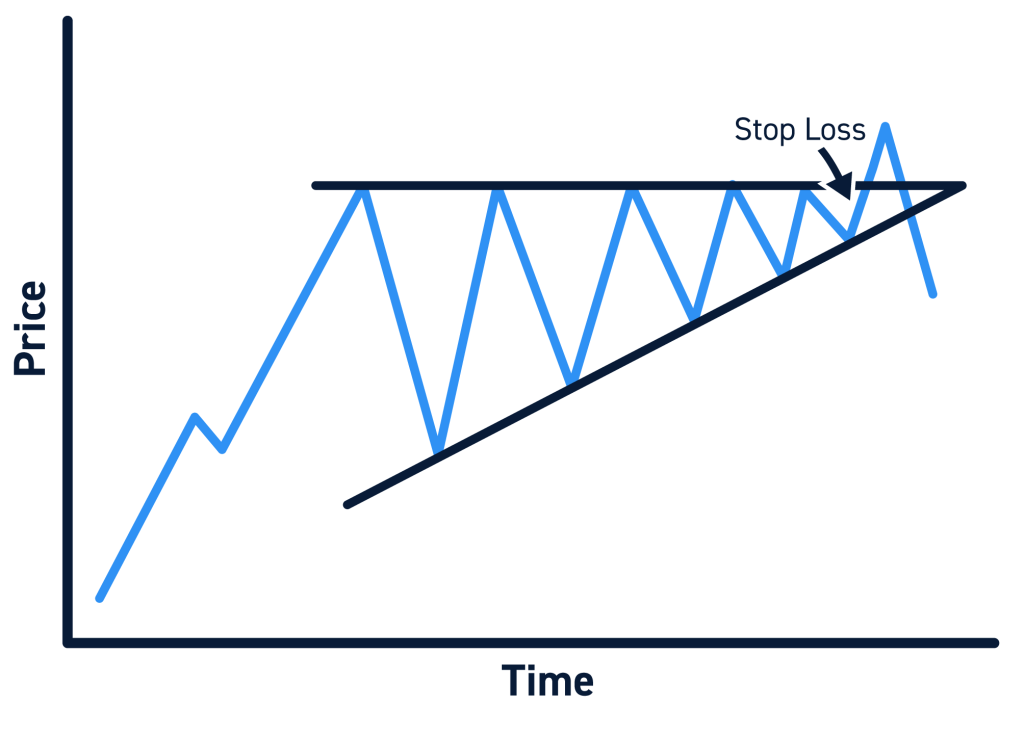
The expected price movement of the breakout is equal to the price difference at the widest part of the ascending triangle pattern. You can measure the distance between the resistance area and the lowest low at the start of the pattern and add that to the resistance area to calculate a profit target for the trade.
When setting a stop loss, set it slightly below the resistance area. It is not uncommon for stocks to retest the resistance line – which becomes a support line after the breakout. They may drop slightly below this line before the breakout continues, but a significant drop below the resistance line signals that the breakout may have failed.
Tips for Trading Ascending Triangles
When trading ascending triangle patterns, there are a few important things to keep in mind.
First, price action prior to the formation of an ascending triangle is relevant. Ascending triangles typically form after a strong uptrend, not after sideways price action.
Second, be patient when waiting for a breakout to occur. It’s typically better to wait for the breakout to be confirmed by high trading volume before entering a trade, or else you risk losing money trying to trade a false breakout. The strongest breakouts occur on strong volume.
Another thing to keep in mind is that a breakout becomes more likely as an ascending triangle progresses. The breakout may also be stronger if the resistance area has been tested numerous times already as the ascending triangle pattern formed.
Finally, always place a stop loss when trading an ascending triangle pattern. Even a breakout that is accompanied by high volume may fail, either resuming the ascending triangle pattern or initiating a reversal.
Ascending Triangle Pattern FAQs
Are ascending triangle patterns bullish or bearish?
Ascending triangles are generally bullish. They typically signal a continuation of an uptrend or, more rarely, a reversal of a downtrend.
What is the difference between an ascending triangle pattern and a descending triangle pattern?
An ascending triangle pattern is a bullish continuation pattern that occurs after a prolonged uptrend. A descending triangle pattern is essentially the opposite. It is a bearish continuation pattern that occurs after a prolonged downtrend.
Where should I set my profit target on an ascending triangle breakout?
The profit target for an ascending triangle breakout is typically equal to the price difference at the widest part of the triangle. Take the difference between the resistance line and lowest low, and add that to the resistance line at the breakout.
Where should I set my stop loss on an ascending triangle breakout?
Consider setting a stop loss slightly below the horizontal resistance line when trading an ascending triangle breakout. This leaves room for the stock to test the horizontal band as new support, but protects you from larger losses in case the breakout fails.


